
Last year the average seller in England and Wales who bought within the last 20 years sold their property for £95,360 more than they paid for it, up from £83,550 in 2020, according to research from Hamptons.
The average gross gain made by someone selling a detached house rose to £151,840, flat seller gains fell to £54,690 in 2021.
One in five (19%) flat sellers in 2021 made a loss on their property compared to 4% of detached house sellers.
London sellers continued to make the biggest gains, but weaker price growth meant that 2021 marked the first time since our records began (2015) that London sellers made a gross gain less than £200k.
People’s reassessment of their homes since Covid-19 began has caused sellers to move sooner. 64% of sellers in 2021 sold their home within 10 years, compared to 59% of sellers in 2019.
Aneisha Beveridge, head of research at Hamptons, said: “Soaring house price growth over the last 18 months has driven up the amount of money homeowners have made. But while owners of larger properties have benefitted from buyers looking for more space, flat owners have seen weaker returns.
“House price gains are primarily driven by two factors – the length of time people have owned their home and the point at which they bought in the housing cycle. Typically, homeowners who have owned their properties for longer have seen more price growth and therefore made bigger profits. Although, most of these profits are never seen by sellers as they are reinvested back into the housing market when they make their next purchase.
“House price gains last year may have been close to their peak. 2021’s average seller bought in 2012, since when house prices across England and Wales have risen by 55%. However, 2022-2024 sellers are likely to have bought more recently, during a period of weaker price growth. We’ve already seen this in London, where seller gains have been falling since 2016.”
Average seller gross profit across England & Wales
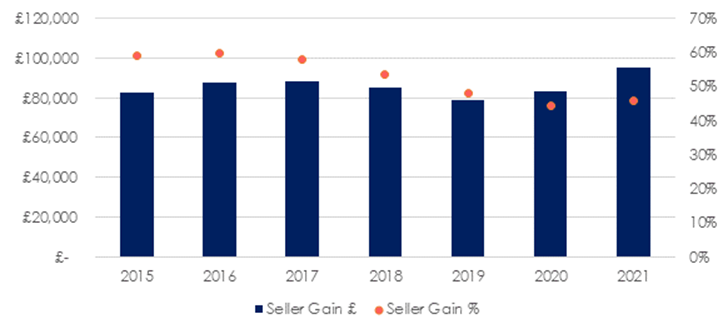
Strong house price growth since the pandemic began has boosted seller gains. The average seller in England and Wales who bought a property within the last 20 years and sold in 2021 made a gross profit of £95,360 (46%), up from £83,550 in 2020. A record 92% of sellers sold their property in 2021 for more than they bought it, having owned it for an average of 8.8 years.
We estimate that sellers across England and Wales made a total gross gain of £128bn from property sales in 2021.
Chart 2 – Seller gross profit across England & Wales by property type
The rise in seller profit has been boosted by the sale of bigger homes, which have typically been owned for longer and therefore benefitted from more price growth. Owners of detached houses accounted for 23% of sellers (and 37% of profit) in England and Wales last year, up from 20% in 2019.
Sellers of detached houses made the biggest gains (£151,840 or 53%), having owned them the longest (9.4 years). The average gross profit on a detached home jumped from £132,240 in 2020 and £122,280 pre-pandemic in 2019 (chart 2).
Flat owners are least likely to sell their home for more than they bought it for, partly because they tend to own for a shorter period (8.2 years in 2021). One in five (19%) flat sellers in 2021 made a loss on their property compared to 4% of detached sellers.
Flat owners were the only sellers to see their gains fall between 2020 and 2021. The average flat seller who sold in 2021 made a gross gain of £54,690 or 29%, down from £62,360 in 2020. Meanwhile the average gain on a terrace property rose to £79,370 (+£8,820) in 2021 and semi-detached sellers made £92,430 (+£11,100) on average.
Table 1 – Seller gross profit by region
| Average seller gain £ | YoY Change | Average seller gain % | Average years of ownership | % who made a profit | |
| London | £197,730 | -£9,640 | 58% | 9.1 | 91% |
| South East | £121,740 | £9,500 | 47% | 8.9 | 93% |
| East of England | £109,980 | £970 | 50% | 8.7 | 95% |
| South West | £90,070 | £11,690 | 42% | 8.3 | 94% |
| East Midlands | £68,420 | £9,750 | 46% | 8.6 | 95% |
| West Midlands | £68,190 | £9,340 | 43% | 8.6 | 94% |
| Wales | £57,490 | £9,650 | 47% | 8.7 | 93% |
| North West | £56,910 | £9,280 | 43% | 8.7 | 90% |
| Yorkshire & the Humber | £53,960 | £8,260 | 40% | 8.9 | 90% |
| North East | £28,960 | £5,540 | 25% | 7.9 | 78% |
| England & Wales | £95,360 | £9,420 | 46% | 8.8 | 92% |
On a regional basis, London sellers continued to make the biggest absolute gross profit. However, weaker house price growth over the last six years has meant that 2021 marked the first time since 2015, which is when our records began, that the average London seller made a gain of less than £200k.
The average London seller sold their property in 2021 for £197,730 more than they paid for it an average of 9.1 years ago. This is down from £207,370 in 2020 and a peak of £243,050 in 2016.
While 91% of London sellers made a gain on their property, 16% of flat sellers in the capital sold at a loss, 54% of whom bought in the capital during the last seven years. Despite this, we estimate that London sellers made a total gross profit of £30.96 bn in 2021.
Sellers in the North East were least likely to make a profit last year. The average seller in the region made an average gross gain of £28,960, 22% of whom sold their home for less than they bought it – on average 7.9 years ago.
£ and % difference between sale and purchase price by local authority
Sellers in London’s most affordable borough, Barking and Dagenham, have seen the biggest percentage gain anywhere in the country. The average 2021 seller in Barking and Dagenham sold their home for 76% more than they paid for it. While sellers in Waltham Forest (72%), Merthyr Tydfil in Wales (71%) and Havering (66%) follow. Twelve of the local authorities where sellers banked the biggest percentage gains in 2021 were located in the capital.
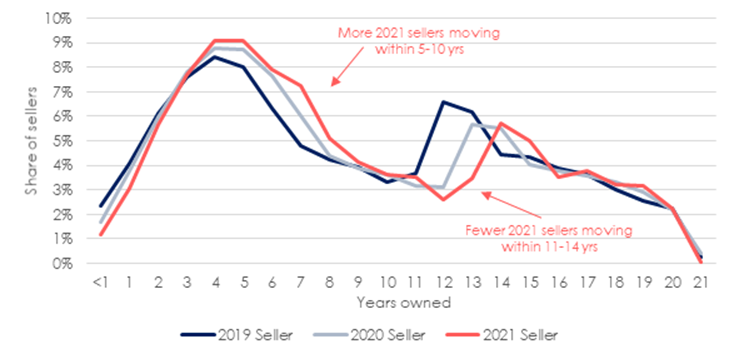
How long sellers in England & Wales owned their home
The pandemic sparked a wave of early upsizers as people searched for more living and working space. 64% of sellers in 2021 sold their home within 10 years, compared to 59% of sellers in 2019. However, the proportion of sellers moving within 11-14 years has fallen from 21% in 2019 to 15% in 2021. Flat owners, in particular, have upsized sooner – 65% of 2021 flat sellers moved within 10 years, up from 63% of sellers in 2019.
Typically, the longer someone has owned a property, the bigger their gain. The average 2021 seller who bought 20 years ago saw their property rise in value by 180%, compared to 23% for someone who bought five years ago. They’re also less likely to make a loss, with less than 1% of sellers who bought 20 years ago making a loss on the sale of their home in 2021 versus 9% of buyers who bought five years ago.
While homeowners who have sold within five years of buying have made similar returns, seller gains have shrunk for those who have owned for a longer period of time. For example, the average seller who owned for 15 years and sold in 2015 made an average gain of 148%. However, a 2021 seller who bought 15 years ago made a 50% gross gain. This is because house price growth across England and Wales has generally been weaker in recent years.
Average % gain by length of ownership
Seller gross profit across England & Wales
| Year of sale | Seller Gain £ | Seller Gain % | Average years of ownership | % of sellers who made a gain |
| 2015 | £ 82,730 | 59% | 8.8 | 86% |
| 2016 | £ 87,560 | 60% | 8.8 | 89% |
| 2017 | £ 88,230 | 58% | 8.8 | 90% |
| 2018 | £ 85,200 | 54% | 8.9 | 90% |
| 2019 | £ 79,100 | 48% | 8.9 | 89% |
| 2020 | £ 83,550 | 44% | 8.8 | 90% |
| 2021 | £ 95,360 | 46% | 8.8 | 92% |