

The total value of all UK homes broke the £8trn barrier in 2021, reaching £8.4trn, a new record high.
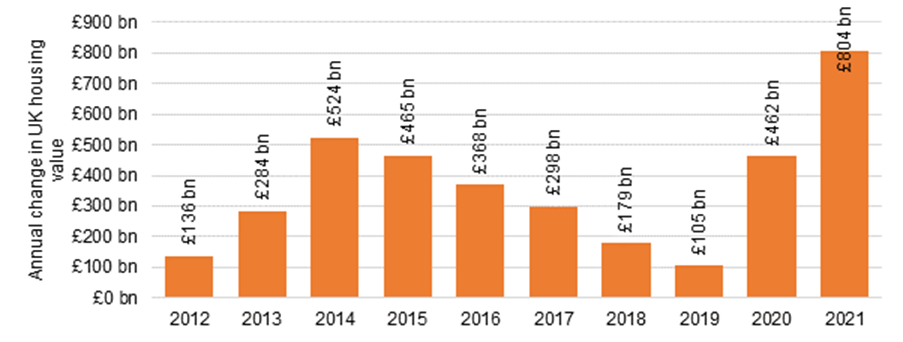
This means UK housing value rose by £804bn in 2021 (+10.6%), from the previous high of £7.61trn in 2020.
This is the fastest annual percentage growth since 2006, and the biggest annual increase in value ever recorded. In total, the value of UK housing has grown by +75.7%, or £3.6trn over the past decade.
“The stamp duty holiday and low interest rate environment created extremely strong market conditions in 2021, encouraging many to move who perhaps wouldn’t have otherwise.
But, over and above that, people’s lifestyle needs and housing preferences hugely shifted over the course of the pandemic, with many reassessing what they want out of their living environment in response to increased working from home and the need for more inside and outside space,” according to Lawrence Bowles, a director in the Savills residential research team.
“A surge in demand for the best homes in hotspots across the UK led to a record number of housing transactions, and significant house price growth in many areas. As a result, we experienced an exceptionally strong year, which has pushed the value of the UK’s housing stock to another record high.”
Graph 1: Annual growth in value of UK housing
The regional divide
Changes in housing value reflect the pattern of moves, with households moving from smaller, urban properties in search of more space in the suburbs and beyond.
In England, the South East saw the greater increase in housing value in 2021, rising by £155bn or 10.9%, followed by the North (£131bn) and London (£130bn). Scotland, Wales and Northern Ireland grew by a combined £98bn – +12.5%.
Table 1: Housing stock vs value by region
| Region | 2021 stock | 2021 value | 2021 increase | 2021 % increase |
| London | 3.57m | £1,886bn | £130bn | 7.4% |
| South East | 3.90m | £1,581bn | £155bn | 10.9% |
| East of England | 2.65m | £954bn | £99bn | 11.6% |
| South West | 2.48m | £789bn | £84bn | 11.9% |
| Midlands | 4.57m | £1,043bn | £107bn | 11.5% |
| North | 6.88m | £1,281bn | £131bn | 11.4% |
| Scotland Wales and NI | 4.56m | £878bn | £98bn | 12.5% |
| Total | 28.61m | £8,411bn | £804bn | 10.6% |
Despite being home to less than half of all housing stock (44%), London and the South still hold the majority (62%) of the total value UK housing stock. Locations that gained the most value over the past year are Cornwall (£16.2 bn), Edinburgh (£12.5bn), and Westminster (£11.3bn).
Looking over a ten year period, London neighbourhoods Barnet (£44.4bn), Kensington and Chelsea (£42.7bn) and Westminster (£42.3 billion) saw the most growth in value. Birmingham and Cornwall were the only two districts outside London to make the top ten.
“Regional markets outpaced London in 2021, driven by a surge in demand for larger homes, for coastal and country properties. This, combined with a shrinking supply of stock, created pockets of extremely strong market conditions,” continued Bowles.
“The north-south divide in house prices looks set to close further over the next five years, further bolstering values outside of London. Not only is there more capacity for price growth in the North, but there also remains more of an affordability cushion. The Government’s levelling-up agenda has the potential to accelerate a rebalancing of the market, but only if it gains meaningful traction.”
Growth by tenure
Government support for homeownership via the stamp duty holiday and record funding from Bank of Mum and Dad combined saw the total value of mortgaged owner occupied homes pass £2.9trn for the first time ever, increasing by £297bn in 2021 alone.
Despite this, the value of housing owned by unmortgaged owner occupiers continued to be the fastest growing housing tenure in 2021, up 12.0% on the year to reach a total of 3.3trn.
Increased institutional investment in the private rented sector saw the tenure grow by £86bn in 2021 – more the double the increase seen the year before. Over the past decade, this sector has increased +77.6%, or £605bn.