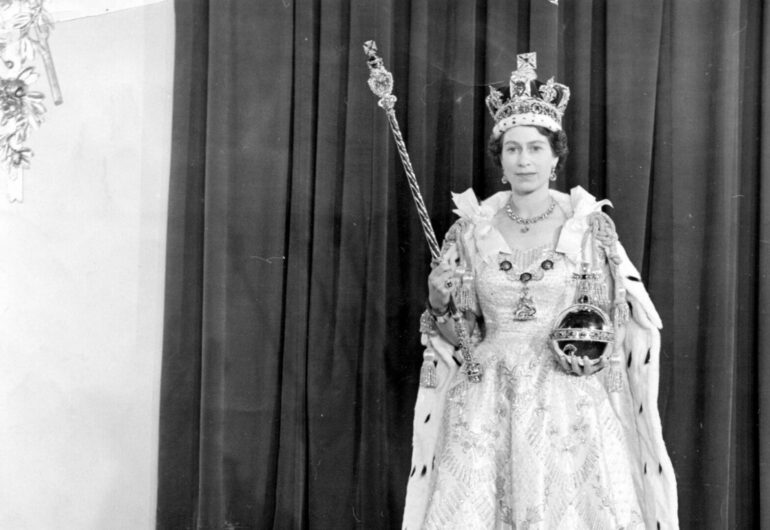
To mark the Queen’s 70th year on the throne AJ Bell has put together a list of just some of the things that have changed in Brits financial lives during her reign.
- Inflation has only been above the current 9% for 10 years of the Queen’s reign
- Average house price was £1,891 in 1952, compared to £260,771 today
- If they had just risen by inflation, they would be £40,566
- House prices were just over four times earnings in 1952, but more than 8 times today
- The state pension was just £1.63 a week for a single person in 1952
- During the past 70 years single people have seen a 8,629% increase in their state pension
- But the average man lived for a year after they claimed their state pension, compared to 13 years today
- In the 1950s, 33% of household spending went on food, compared to 11% today
Laura Suter, head of personal finance at AJ Bell, walks us through the changes:
“It’s 70 years since the Queen took to the throne and lots has changed during those past seven decades, not least of all our finances. Back in 1952 almost everything was done with cash and cheques were nearing their height of popularity, whereas today most of us pay for things with the tap of a card or phone, using digital payments.
“Whether it’s interest rates, inflation, house prices, our pensions or how we all spend our money each month, a whole host of our personal finances have changed during the Queen’s reign. Some of those are positive moves, such as the state pension becoming more generous or wages improving dramatically. But, conversely, soaring house prices have seen our spending on housing take up a much bigger part of our household spending as wages have failed to keep pace.”
Interest rates and inflation
“During the past 70 years inflation has averaged 4.6% and back when the Queen took to the throne inflation sat at 9.2% — showing that current high inflation isn’t that unusual. During her 70-year reign inflation has been above the current 9% for 10 years, so a seventh of her reign. But it peaked at a whopping 24.2% in 1975, a period where inflation was at double digits for eight straight years. The lowest inflation was 0% in 2015, which marked the start of a period of lower inflation: it has been below 5% for the past 30 years.
“When the Queen took to the throne in 1952 the Bank of England’s interest rate stood at 2.5%, before jumping to 4% just after she became Queen. It hit its peak in the 1970s when the Bank was trying to battle soaring inflation, and interest rates hit 17%. In fact, rates spent the majority of the 70s and 80s in double digits, making the current 1% interest rate looks very low compared to history.”
State pension
“When the Queen took to the throne, the basic rate state pension was £1.63 a week for a single person (or £84.76 a year) and £2.70 a week for married couples, or £140.40 a year. This compares to the current figures of £141.85 a week for a single person and £226.85 a week for a married couple. During the past 70 years single people have seen a 8,629% increase in their state pension, while married people have seen a 8,302% uplift.
“What’s more, the state pension has increased far ahead of inflation. If it had kept pace with inflation it would be at £1,755 a year today for a single person and £2,892 a year for a married couple. (Compared to the current annual figures for the basic rate of £7,376 and £11,796).
“That said, in relation to earnings (see below) the state pension hasn’t kept pace. In 1952 the state pension amount was 31% of average full-time earnings at the time, while now it is just 23% of average full-time earnings.
“However, during that period life expectancy has changed dramatically, thanks to healthier lifestyles and improvements in medicine, which means people are claiming the state pension for far longer. In the 1950s the average life expectancy of a man nearing state pension age was actually 44, while for women it was 47, meaning the average person never made it to state pension age – which was 65 for men and 60 for women.
“Fast forward to today, and the average life expectancy for men nearing retirement age now is 68 years and 74 years for women. Even though the state pension age has risen to 66 for both men and women, it means the average man today spends two years on the state pension and the average woman claims it for eight years.”
Earnings
“Earnings clearly looked very different back in 1952, and the average male working full time earnt £8.70 a week, which equates to £452 a year. The average female worker earned £4.60 a week or £240 a year.
“Now, average weekly earnings for full-time staff is £611 a week, so £31,772 a year. Wages have risen far ahead of inflation, which would have brought the average male wage to £9,696 a year and average female wage to £5,149.
House prices
“We’re a nation who loves property, and that love affair coupled with a shortage of properties being built and a population boom means that house prices have soared during the Queen’s reign. According to the Nationwide house price index, the average UK house price in 1952 was just £1,891 and house prices actually fell for a couple of years after the Queen took to the throne.
“If they had kept up with inflation the average house price today would be £40,566. Now, according to the index, the average house price is actually £260,771 with house prices having risen 12.6% in the past year alone.
“What’s more, wages haven’t kept pace with house prices. Back in 1952 the average house price was just over four times the average annual income at the time. However, now it sits at more than eight times average full-time earnings, showing one of the barriers for people trying to get on the property today.”
Where we all spend our money
“Our household budgets were spent in a very different way 70 years ago, as during that period food and clothing costs have fallen dramatically in real terms but housing costs have risen considerably. It’s tricky finding information on shopping habits all the way back to 1952, but just five years later there are some good figures on how people spent their income.
“In 1957 a third of all household expenditure went on food, a figure that has now fallen to 11%, thanks to the significant lowering in food costs over that time. At the time the Queen became monarch only 8% of households actually owned a fridge.
“Smoking was far more prevalent in the 1950s and so 6% of all spending went on tobacco, compared to less than 1% now. Alcohol spending has remained similar, at 3% in the 50s and 2% today. But housing costs have rocketed, including both rent and mortgage payments, with 9% of expenditure going on housing in the 1950s compared to 14% today. Clothing costs have fallen dramatically too, with 10% of household spending going on clothes 70 years ago, compared to just 4% now.”
| Where does our household income go, now vs then | ||
| Area | 1950s | Now |
| Housing | 9% | 14% |
| Food | 33% | 11% |
| Clothing | 10% | 4% |
| Alcohol | 3% | 2% |
| Tobacco | 6% | 1% |
| Source: ONS data |