
House prices in predominantly rural areas have risen by 29% over the past five years, compared to 18% in predominately urban areas, according to Nationwide’s latest housing market survey
Rural detached properties have seen strongest rates of price growth, whilst urban flats have seen the weakest.
Some 13 of the top 20 local authorities for house price growth in 2021 are classed as rural.
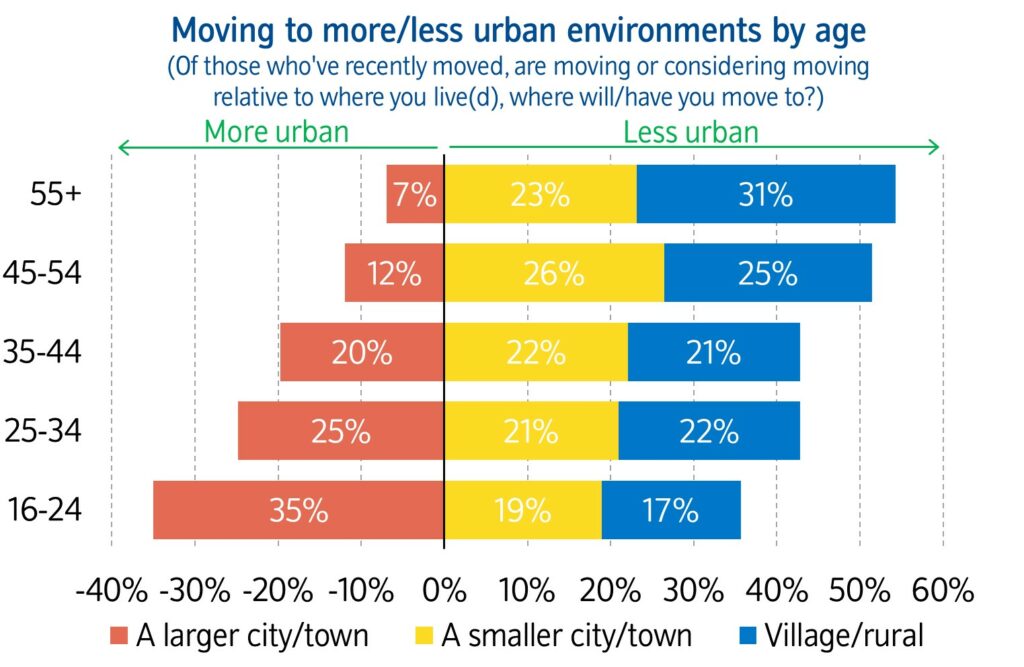
Andrew Harvey, senior economist at Nationwide, said: “According to our latest housing market survey, 28% of those who had recently moved, were moving or considering a move, were looking to move to a different area.
“The majority of people are looking to move to less urban areas, with this preference more pronounced for older age cohorts, as shown in the chart below.
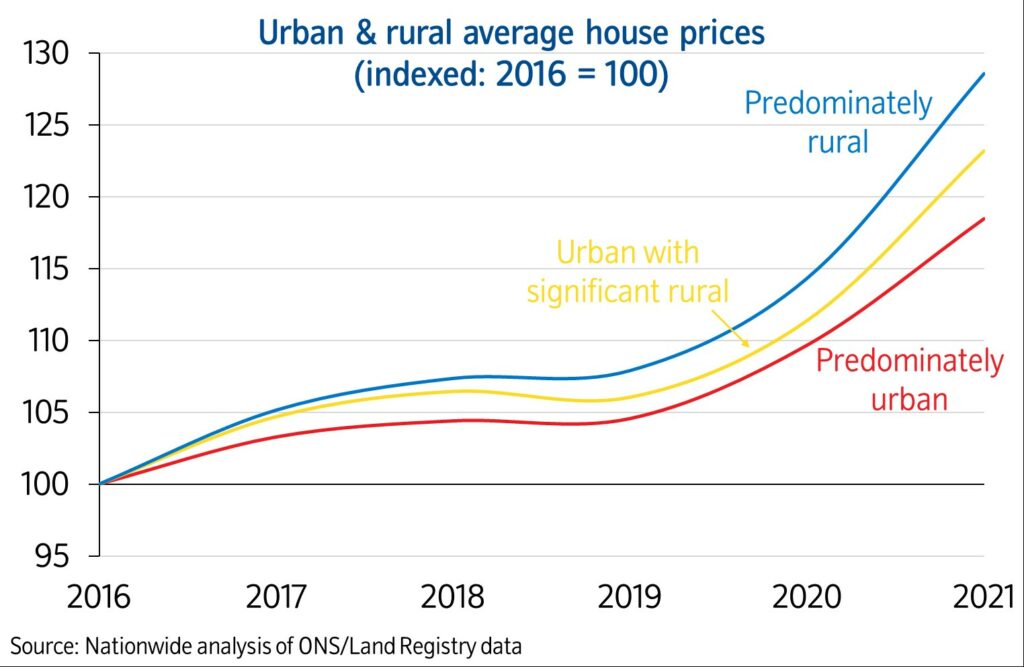
“Our latest analysis suggests that average house price growth in local authorities classified as predominantly rural has outpaced that of other areas, particularly in the last couple of years.
“Between December 2016 and December 2021, average prices in predominantly rural areas increased by 29%, compared with 18% in predominantly urban areas. Local authorities classified as ‘urban with significant rural’ saw price growth of 23% over the same period.
“Average house prices in predominantly rural areas rose by more than 12% in 2021, double that seen in 2020. 13 of the 20 top performing local authorities were classified as rural, with North Devon recording the strongest growth – average house prices up 24% year-on-year.
“Meanwhile, Camden in London was the top performing urban authority, with a 20% increase over the year. See full table below.
“It is notable that the list features a number of areas closely associated with tourism, including parts of Devon, South Wales, the Cotswolds and the Broads.
“This suggests some of the demand may be being driven by those buying holiday or second homes. Indeed, ONS data suggests that the rate of second home ownership is significantly above average in areas such as South Hams, Pembrokeshire and Ceredigion, areas which are amongst those seeing the fastest rates of growth.
“We’ve used the ONS’ broad rural urban classification, which looks at the proportion of the population in local authorities living in different area types. In local authorities classed as ‘predominantly rural’, more than half of the population live either in rural settlements or market towns. In authorities classed as ‘urban with significant rural’, between 26% and 49% of the population live in either rural villages or market towns.
“In ‘predominantly urban’ local authorities, 75% or more of the population are either in towns or cities.
| Top performing local authorities (2021) | ||||
| Local Authority | GOR | Rural urban classification | Avg price (Dec-21) | % chg |
| North Devon | S West | Rural | 326,848 | 24% |
| South Hams | S West | Rural | 420,851 | 22% |
| Rushcliffe | E Mids | Rural | 355,398 | 22% |
| Ceredigion | Wales | Rural | 244,619 | 21% |
| Camden | London | Urban | 947,511 | 20% |
| Hastings | S East | Urban | 271,432 | 19% |
| Pembrokeshire | Wales | Rural | 231,355 | 19% |
| South Norfolk | East | Rural | 330,003 | 19% |
| Cotswold | S West | Rural | 481,402 | 19% |
| Eilean Siar | Scot | Rural | 144,755 | 19% |
| Torridge | S West | Rural | 293,098 | 18% |
| Vale of Glamorgan | Wales | Urban | 287,199 | 18% |
| Mid Devon | S West | Rural | 287,337 | 18% |
| Eastleigh | S East | Urban | 339,946 | 18% |
| Broadland | East | Urban with sig. rural | 319,182 | 18% |
| Hyndburn | N West | Urban | 120,038 | 17% |
| Somerset West & Taunton | S West | Rural | 286,910 | 17% |
| Maldon | East | Rural | 399,937 | 17% |
| East Hampshire | S East | Rural | 451,320 | 17% |
| Wyre Forest | W Mids | Urban with sig. rural | 241,109 | 17% |
“Of the 362 local authorities in Great Britain, 212 (59%) are classified as predominately urban, 98 (27%) as predominately rural, while the remaining 52 (14%) are classed as urban with significant rural. The South West has the highest proportion of rural local authorities, with nearly 60% being predominately rural (17 out of 29), while London unsurprisingly has none.
“The tables below show the top performing local authorities in terms of annual house price growth in 2021 split by rural & urban.
| Top performing rural local authorities | |||
| Govt Office Region | Local authority | Avg price (Dec-21) | % chg |
| South West | North Devon | 326,848 | 24% |
| East Midlands | Rushcliffe | 355,398 | 22% |
| Wales | Ceredigion | 244,619 | 21% |
| East of England | South Norfolk | 330,003 | 19% |
| Scotland | Eilean Siar | 144,755 | 19% |
| South East | East Hampshire | 451,320 | 17% |
| Yorkshire* | Ryedale | 311,112 | 17% |
| North West | Ribble Valley | 255,116 | 16% |
| West Midlands | Wychavon | 326,259 | 14% |
| North East | County Durham | 119,566 | 9% |
| Top performing urban local authorities | |||
| Govt Office Region | Local authority | Avg price (Dec-21) | % chg |
| London | Camden | 947,511 | 20% |
| South East | Hastings | 271,432 | 19% |
| Wales | Vale of Glamorgan | 287,199 | 18% |
| North West | Hyndburn | 120,038 | 17% |
| Scotland | Fife | 166,870 | 16% |
| South West | Torbay | 243,433 | 16% |
| West Midlands | Nuneaton & Bedworth | 216,966 | 15% |
| East Midlands | Blaby | 279,412 | 15% |
| North East | Sunderland | 137,274 | 13% |
| East of England | Harlow | 308,609 | 12% |
| Yorkshire* | York | 303,795 | 12% |
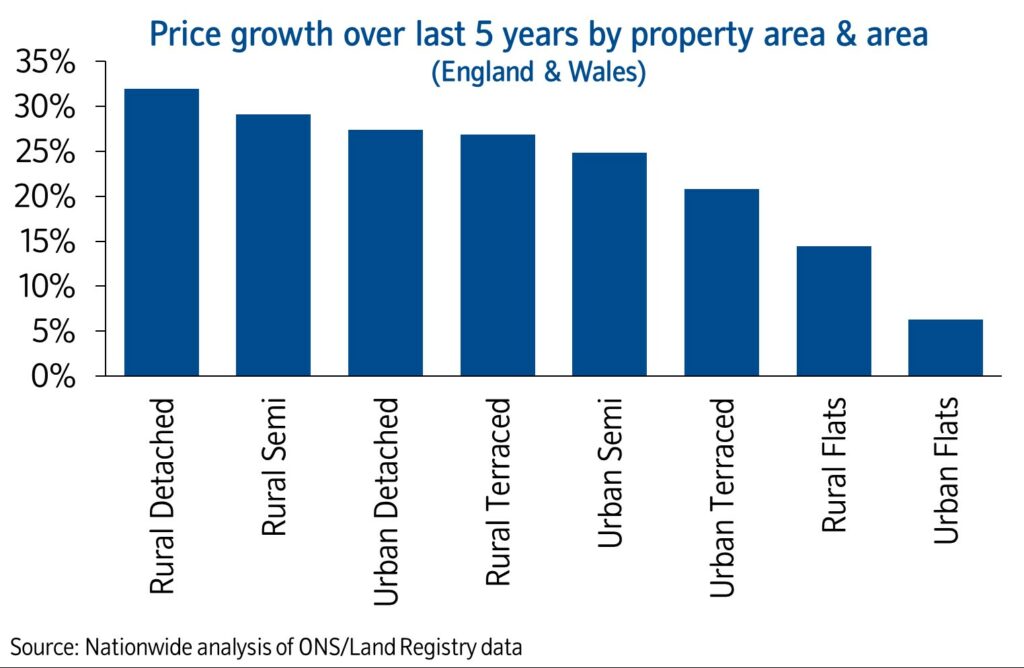
Rural detached properties have seen strongest growth over past five years
“Increased demand for properties in rural areas in recent years has been part of the ‘race for space’ seen since the start of the pandemic.
“However, this shift in preferences is also reflected in price trends by property type. Between December 2016 and December 2021, rural detached properties saw the strongest price growth, with average prices increasing by 32%.
“Rural semi-detached houses increased by 29% over the same period, while urban detached properties and rural terraced houses both saw average prices increase by 27%. Flats saw considerably weaker price growth, particularly those in predominately urban areas, which increased by just 6% over the last five years.
“Despite this, the average price of a detached property in predominantly rural areas is still nearly 10% lower compared with the average for predominately urban areas. This may be because detached properties attract a particular premium in urban areas, making up a smaller proportion of the housing stock.
“For example, in local authorities classified as predominately urban, only 12% of the total stock is detached, compared with 26% in predominately rural areas.”