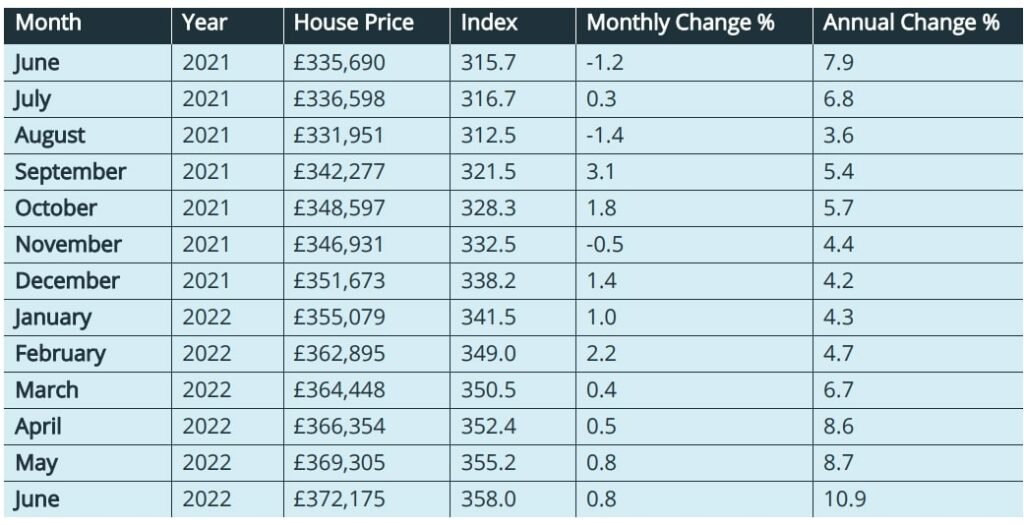
The average price of a house in England and Wales now stands at £372,175, up 0.8% on May, according to the latest house price data from e.surv.
When it comes to house price growth Wales leads the pack for the eleventh month running while London has the lowest.
e.surv also found that the average conveyancing delays of five months are now the norm
Richard Sexton, director at e.surv, said: “Our data this month shows house price growth continuing. The average price paid for a home in England and Wales in June 2022 was £372,175, up by £2,870, or 0.8%, on the revised average price paid in May.
“From the start of the pandemic in March 2020, to the end of May 2022, house prices have increased by some £53,430, or 16.9%.
“All ten of the regions in our survey have experienced rising prices over the last twelve months, with nine of the ten setting new record average house prices in May 2022.
“Wales remains the strongest performing region – with the highest annual growth rate, a position it has now held for eleven months, and with real terms increases in prices. The return to work has seen a change in the fortunes of the South East, with Greater London now taking second place as prices over the twelve months have risen by 10.2%.
“What is clear in our data is that house price growth remains resilient notwithstanding the pressures in the broader economy. This is possibly because the squeeze on the cost-of-living is not yet being absorbed equally across society.
“Home owners, for now, are relatively unscathed. Indeed, arrears figures remain at historic lows. Housing, as an asset group, continues to outperform other classes and so remains attractive to investors – particularly good quality properties. As ever a lack of supply of desirable stock and strong employment in the UK economy continues to support price growth.”
Table 1. Average House Prices in England and Wales for the period June 2021 – June 2022
Commentary
John Tindale and Peter Williams, Acadata senior analysts
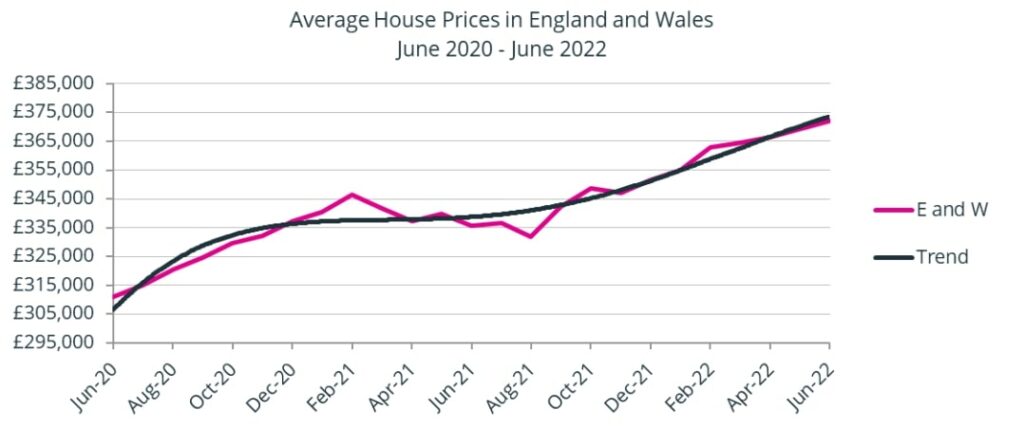
Figure 1. The average house price in England and Wales, smoothed, June 2020 – June 2022
The rise in house prices continues unabated. The average price paid for a home in England and Wales in June 2022 was £372,175, up by £2,870, or 0.8%, on the revised average price paid in May.
This sets yet another new record level for England and Wales – and for the eighth time in the last nine months, thus underlining the recent strength of the market. From the start of the pandemic in March 2020, to the end of May 2022, house prices have increased by some £53,430, or 16.9%, which contrasts with the increase in CPIH of 10.2% over the same period. We have thus seen increases in real terms.
As Figure 1 above shows, the average house price in England and Wales has continued to rise throughout the first six months of 2022 on a near straight-line basis, confounding all the predictions of a slowing growth rate, and despite the wider economic context, although delays in reporting the data may also be having some effect on recording price movements
Average Annual Regional House Prices
Figure 2. The annual change in the average house price for the three months from April 2022 to June 2022, analysed by GOR
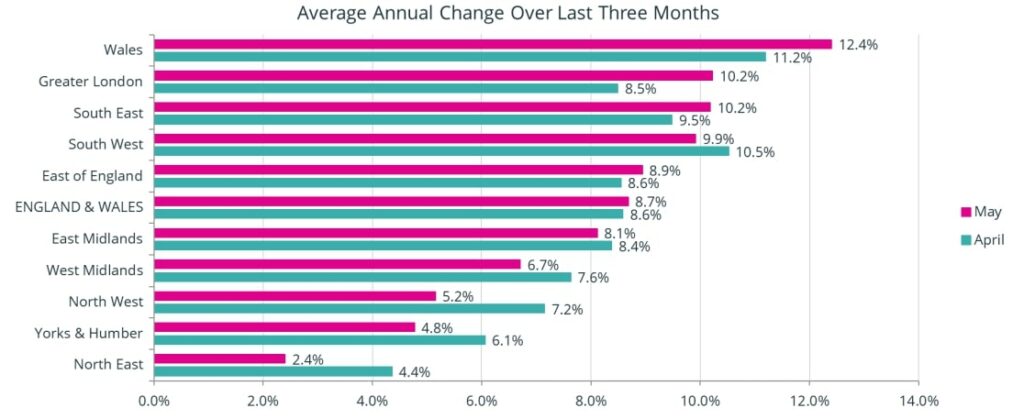
Figure 2 shows the percentage change in annual house prices on a regional basis in England, and for Wales, averaged over the three-month period of April to June 2022, compared to the same three months in 2021. These figures are produced on a rolling three-month basis, with Figure 2 showing the similarly-averaged figures from one month earlier.
All ten GOR areas have experienced rising prices over the last twelve months, with nine of the ten setting new record average house prices in May 2022. The one exception is the North East, where prices in Tyne and Wear and County Durham – the two largest conurbations in the region in terms of house sales – fell by -0.9% and -2.7% respectively in the month.
Wales remains the GOR area with the highest annual growth rate, a position it has now held for eleven months, and with real terms increases in prices. Twenty-one of the twenty-two local authority areas in Wales have seen prices rise over the period, the one exception being Denbighshire.
Five local authority areas in Wales (two fewer than last month) have annual house price growth in excess of 15%, the highest being the Isle of Anglesey, where average prices have increased by 22.8%, with detached homes in the area rising from £304k in May 2021, to £358k one year later.
On the Isle of Anglesey, 49% of properties sold over the past four years were detached homes – a proportion that was only exceeded in Great Britain by Ceredigion in Wales (52%) and Lincolnshire (50%). As we discussed last month, detached homes saw the largest gain in average prices throughout the pandemic. Some of the price pressures in Wales derive from demand which is England-based. The Welsh government is moving to take further steps to give local authorities more powers to control second home ownership and holiday lets. This will take effect in 2023.
In second place is Greater London, where prices over the twelve months have risen by 10.2%. As shown in Figure 3 below, price growth in London has been the lowest of all the 10 GOR areas since the start of the pandemic, as purchasers looked to move out of the capital into the more open countryside of the South East and beyond. However, from March 2022 onward, we began to see that some buyers were moving back into central London to take advantage of the lull in prices, as offices in the capital started to re-open. Additionally, the quarantine rules that had been in place for visitors to the UK were removed, allowing overseas buyers to travel to the United Kingdom with more confidence. This resulted in an increased level of purchases, with areas such as Kensington and Chelsea and the City of Westminster proving to be much-favoured locations. These two boroughs have recently returned to substantial annual growth rates, reaching 18.2% and 23.7% respectively
Four of the ten GOR areas have seen an increase in their annual rates of growth, compared to the previous month. The GOR area with the largest increase in its growth rate is Greater London, up from 8.5% last month, to 10.2% this month. The two areas with the largest falls are the North East and the North West, both witnessing a decline of 2.0% from the rates experienced last month.
England and Wales Regional Heat Map
These different trends are evident in the Regional Heat Map shown below for May 2022.
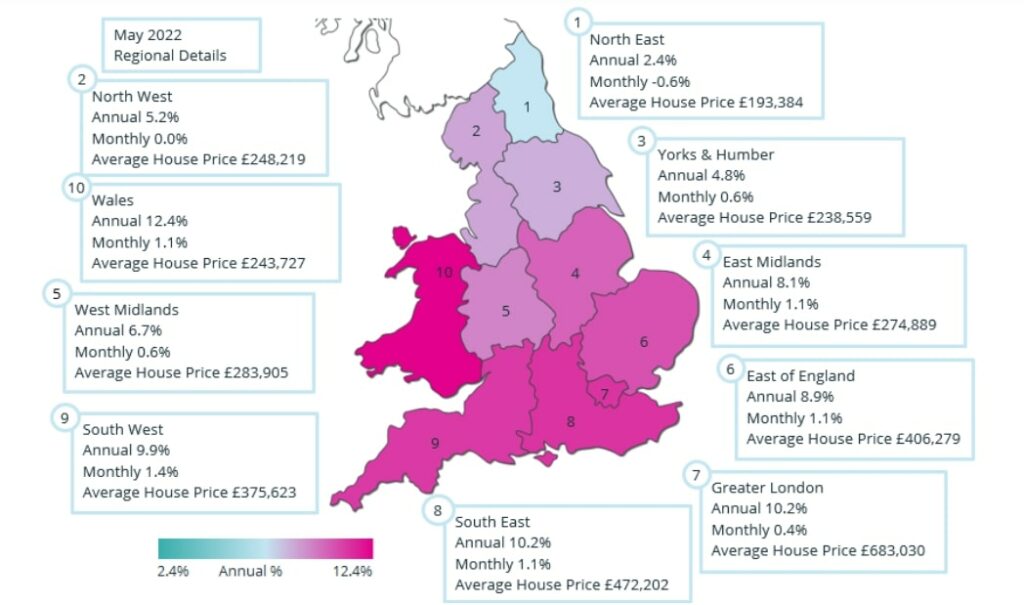
There are five distinct groupings in England and Wales in terms of house price growth, with the hottest markets in Wales and the South of England, and then an evident cooling as you move further north. We start with Wales, out on its own at 12.4%, some 2.2% points ahead of all nine English regions.
The next grouping is in the south of England, with the South West, the South East and Greater London having rates between 9.9% and 10.2%. There follows a grouping of the East and West Midlands and the East of England with rates between 6.7% and 8.9%, with the fourth group of Yorkshire and the Humber, along with the North West at 4.8% and 5.2% respectively. Finally we have the North East at 2.4%, being half the rate of Yorkshire and the Humber.
The housing market in summer 2022
Picking a path through the myriad of published housing market statistics is a difficult job when it comes to being clear as to the trends. As we have noted above, the predicted slowing in the market has yet to take place, and this e.surv release focusses on what has happened – as distinct from what might happen.
Bearing in mind some of the data uncertainties, we must remain cautious, but the monthly data has shown some slowing from the early part of 2022 and that is in nominal prices. Given near double-digit inflation, house prices have just about kept pace with that, though are well in excess of wage inflation. Mortgage rates have been rising, so pressures on some households may be intensifying.
The picture on transactions is also less than clear, given the processing backlog discussed below. The Land Registry data suggests volumes in England and Wales are down compared to previous years, but HMRC’s own estimate for May 2022 is that there were 89,720 sales in the month compared to 84,780 in May 2019. The latest RICS survey (for May and published in June) shows that prices were supported by fewer instructions to sell, and that this offset reduced buyer activity. As always, housing market outcomes are a complex interaction of supply and demand.
Price increases since the start of the pandemic (March 2020)
Figure 3. The % change in house price growth by GOR area, for the period from March 2020 to May2022

Figure 3 shows the % change in average house prices since the start of the pandemic in March 2020, to May 2022. Wales experienced the highest growth in prices over the period at 25.5%, followed by the South West and the North West at 24.8% and 21.7% respectively. This grouping reflects one of the major trends in house purchases during the pandemic, with purchasers competing for scarce larger homes in much-loved holiday areas in England and Wales.
At the other end of the scale we have Greater London, at 6.4%, where there has been an exodus to greener areas outside the capital. Greater London has also been affected by a movement away from flats to homes with more space, partly arising from the government recommendations to “work from home”, and also partly due to the aftermath of the Grenfell Tower fire, with a need to obtain an EWS1 certificate to satisfy the mortgage lenders that any flat cladding was “fit for purpose”. In many cases, these certificates proved hard to obtain, which reduced the demand for flatted properties.
Transactions
Figure 4. The number of housing transactions per month, January 2017 – April 2022
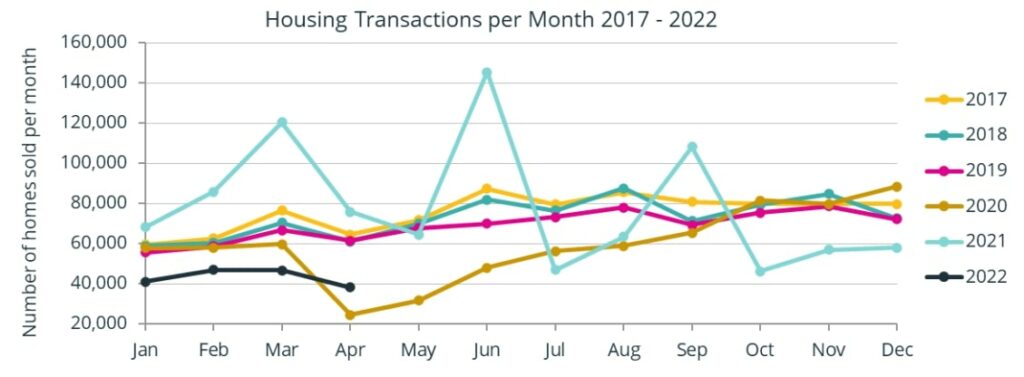
Figure 4 shows the number of domestic housing transactions per month recorded in England and Wales at the Land Registry for the period from January 2017 to April 2022.
As the chart shows, the years 2017 – 2019 were relatively normal, with not too many fluctuations from one year to the next. However, from the start of the pandemic in March 2020, more pronounced changes can be seen in home-buying behaviour, as housing transactions in April 2020 plummeted, to be followed by a return in housing sales as confidence began to re-build. This then turned into a period when sales exceeded previous levels, as lifestyle changes resulted in an increase in demand, especially for properties with space to allow for working from home.
There are three conspicuous peaks in 2021 (the light blue line) shown on the graph, along with three associated troughs. The peaks are all stamp duty-related events, occurring in March, June and September 2021. The March 2021 event was one month before the original date planned for Chancellor Sunak’s SDLT tax holiday to end – this termination date was extended to 30 June 2021 at its full rate, and to 30 September 2021 at a reduced rate – but the announcement of its extension wasn’t made until 3 March 2021, and many purchasers already had plans to buy a property within the original timescale – hence the March 2021 spike.
The second peak was in June 2021, the final date within which the full SDLT tax holiday was available in England under Sunak’s revised plans, and the final date for the LTT holiday in Wales. The third peak, in September 2021, was the last month of the reduced-rate SDLT tax holiday in England.
Each peak is followed by a trough, indicating the extent to which buyers were able to bring forward their purchases into a tax-saving month, resulting in fewer buyers the following month when the higher rates of tax were re-applied.
It is difficult to determine whether the apparent lack of sales from October 2021 through to April 2022, compared to previous years, is due to a “true” reduction in sales, or whether this is the result of the Land Registry falling behind in its ability to process the increased number of transactions that took place during June and September 2021.
Conveyancing delays and their impact on transactions data
Rightmove, in its property blog this month, is advising purchasers that if they wish to move into their newly-purchased homes before Christmas 2022, they should buy a property now, as the conveyancing process is currently taking an average 150 days to complete.
Rightmove also report that some 500,000 homes are currently sold, subject to contract, and which are waiting for contract completion. Rightmove advise that this figure is 44% higher than in 2019.
This delay in the conveyancing process will also be affecting our House Price Index, since the index sale date is based on the month of contract completion, as opposed to the offer date. Consequently, the Acadata sales data may well be reflecting consumer sentiment from some five months earlier. Hence June 2022 sales data may well be describing the state of the market in January 2022.
The Bank of England interest rate rise of 0.25% – which increased the overall rate to 0.5% – was announced on 2 February 2022, but had little immediate impact on the England and Wales housing markets. However, this increase and subsequent rises in rates are working their way through.
For the record, the ONS UK HPI will be subject to the same difficulties as the Acadata index – since both indices use the HM Land Registry for their source data, with contract completion being used as the “sale date”. The Halifax and Nationwide House Price Indices will not be subject to the same problem, since the timing of their respective sales are based on their own mortgage approval dates
The Rightmove Index also uses a different definition for its “sales date”, being the date on which the various Estate Agents inform Rightmove that an offer on the property for sale on its portal has been made and accepted.
In the current situation of long conveyancing delays, it is difficult to judge between cause and effect. Are the delays being caused by a failure at Land Registry to undertake the work required for contract completion, or are they the result of other activities in the conveyancing process ‘gumming-up’ the works, which are preventing the Land Registry from being able to complete in a timely fashion? What we do know is that the Land Registry is currently half way through recruiting and training 800 new caseworkers to tackle delays that exist in some areas of its activities.
Table 2. Comparing the number of housing transactions per month, for the six months Dec 2018 – May 2019 and Dec 2021 – May 2022, between the Land Registry (HMLR) and Revenue & Customs (HMRC)

Table 2 above compares the residential transaction counts between HM Land Registry and HMRC for the period from December 2018 – May 2019 and December 2021 – May 2022. Looking first at the HMRC counts, we can see that the number of transactions in each of the six months of the later period of 2021/2022 are larger than for the earlier six months of 2018/2019, with an average increase of 11.3% across the two years.
This contrasts with the Land Registry counts, which in each month are smaller than those of the HMRC. Over the two years we see that the later year has on average -31.6% fewer sales than the earlier year. This suggests that, assuming the increase in the two different counts should be approximately equal, then the Land Registry has still to process an additional 42.9% of its 2018/2019 total (ie 31.6% plus 11.3% times 383,032) which equates to some 165,000 outstanding sales.
Although the 165,000 missing sales calculated above does not match the Rightmove figure of 500,000 sales awaiting contract completion, we do not know how Rightmove arrives at its figure.


