


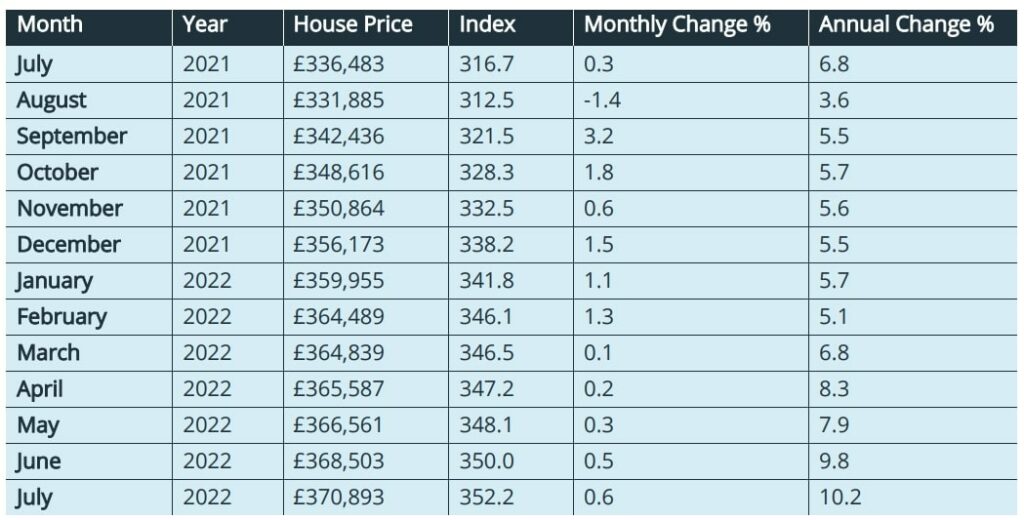
Annual house price growth in England & Wales increased to 10.2% in July, according to the latest house price data from e.surv.
However, the surveying firm warned that the increase reflected the low annual comparison point in July 2021.
Six regions record growth increases of more than 4.0% with London experiencing the lowest regional price growth rate.
e.surv now places the average house price in July at £370,893, up 0.6% on June.
Richard Sexton, director at e.surv, said: “We have spoken before about records being broken but the strength of house prices in the UK continues to perform in stark contrast to the general tone of broader UK economic news.
“Our data, unlike other indices, reports all mortgaged and cash sales across England and Wales and shows that the average price paid for a home in England and Wales in July 2022 was £370,893, up by some £2,400, or 0.6%, on the revised average price paid in June.
“We know the market faces some headwinds that have not yet made themselves felt in the data we are seeing for sale prices to date.
“But we should not forget that there are also more positive tailwinds that continue to mean residential property is an attractive proposition for many.
” Full employment and the available returns which our data shows, make housing a good investment choice compared to many other asset groups.
“There are some buyers and investors fortunate enough to be more immune to interest rate rises so far and they are still buying and selling.
“It may feel like a lifetime ago, but from the outset of the pandemic in the first quarter of 2020 to the end of June 2022, the average house price has increased by some £52,600, or 16.7%.
“This contrasts with the increase in consumer price inflation (including housing – CPIH) of 11.0% over the same period. Property prices have risen in real terms.
“Obviously increasing rates will impact appetites and create affordability issues for some, but the supply issues facing the market remain a force for maintaining pressure for house price growth.”
Commentary: John Tindale and Peter Williams, Acadata senior analysts
The seemingly remorseless rise in house prices continues, with increases occurring in each of the last eleven months.
The average price paid for a home in England and Wales in July 2022 was £370,893, up by some £2,400, or 0.6%, on the revised average price paid in June. This underlines the continuing strength of the market and its ability to confound analysts.
From the start of the pandemic in March 2020 to the end of June 2022, the average house price has increased by some £52,600, or 16.7%, which contrasts with the increase in consumer price inflation (including housing – CPIH) of 11.0% over the same period. Property prices have thus risen in real terms.
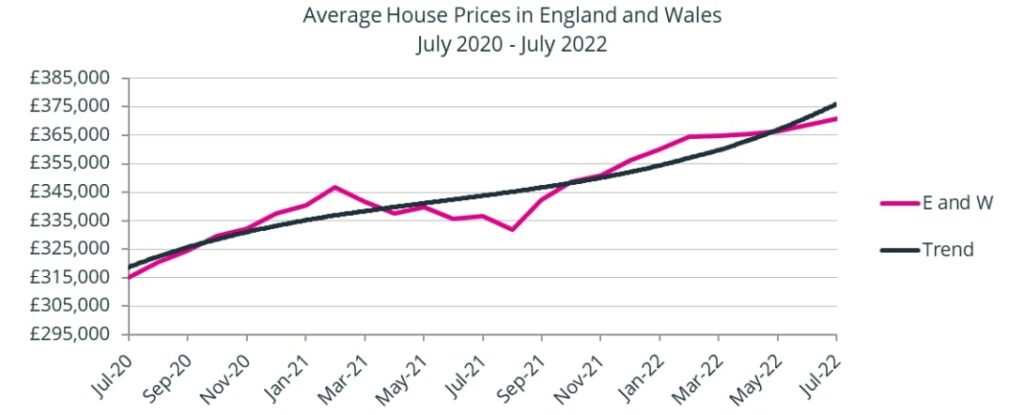
As Figure 1 above shows, our HPI continues to record growth in the average house price throughout the first seven months of 2022 on a near straight-line basis, and despite predictions of a slowing growth rate given the wider economic context.
The latest Halifax Index is currently reporting – for the first time in thirteen months – the smallest of falls in its monthly growth rate, of -0.1% for the UK. However, that is based on the lender’s own mortgage business, unlike Acadata which is reporting all mortgaged and cash sales across England and Wales.
The housing market in summer 2022
As noted last month, given all the data uncertainties that exist, a degree of caution must be applied in assessing the figures.
With sharply rising interest rates and gloomy predictions regarding the state of the economy, it is probably too easy to focus on all the downside risks.
We do know that interest rate rises take some months to impact fully on the housing market, partly because around 80% of borrowers are on fixed rates, and so are protected from the rises for varying periods of time.
Similarly, while costs are increasing in many parts of the economy, and wages are often lagging behind, the pressures are not evenly spread across all households – hence depending upon market and occupation, some buyers/households may be better able to cope with the challenges posed than others, and this will impact on transactions and prices.
While in the short term, the housing market is to a degree insulated from some of what is unfolding, and prices may be lagging behind the emerging realities, as the economy slows and monetary tightening continues, so housing markets could come under pressure.
However, as the Bank of England’s chief economist has suggested, though the market may slow, it will not contract in line with previous major downturns.
For the moment, the data does not indicate we have reached an inflexion point in price trends. With Acadata capturing both cash and mortgaged transactions, the e.surv index is well placed to track the evolving dynamics of the whole market as each month passes.
Given potential fiscal interventions, it is possible that the economy might stage an earlier recovery – although much turns on how the Bank of England moves on interest rates, as well as what is now known as quantitative tightening, scaling back its bond purchase programme. This had allowed lenders access to very cheap funds from the Bank – a route no longer available.
One piece of good news this month was the official removal of the 3% mortgage stress test applied to the debt service capacity of all loan applicants.
This may allow a little more headroom for some borrowers, albeit that lenders have to date not removed it from their own calculations.
However, over time market dynamics will result in some movement here, but it will still offer a degree of help to several thousand would-be borrowers.
Average Annual Regional House Prices
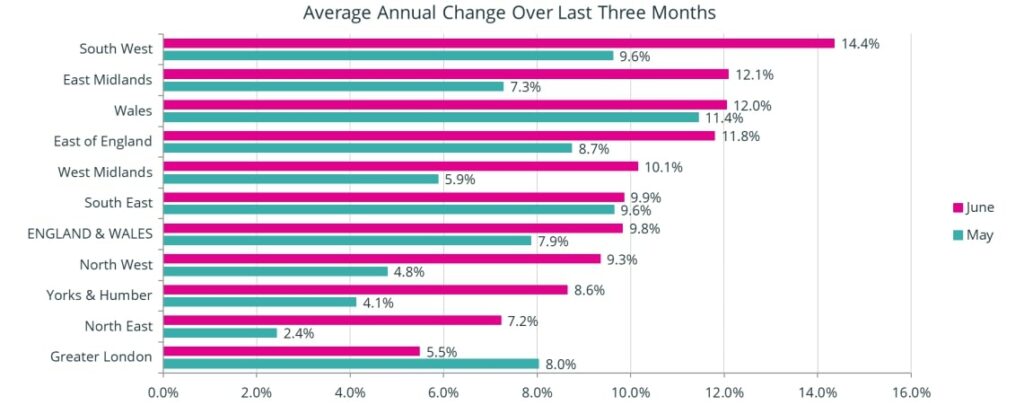
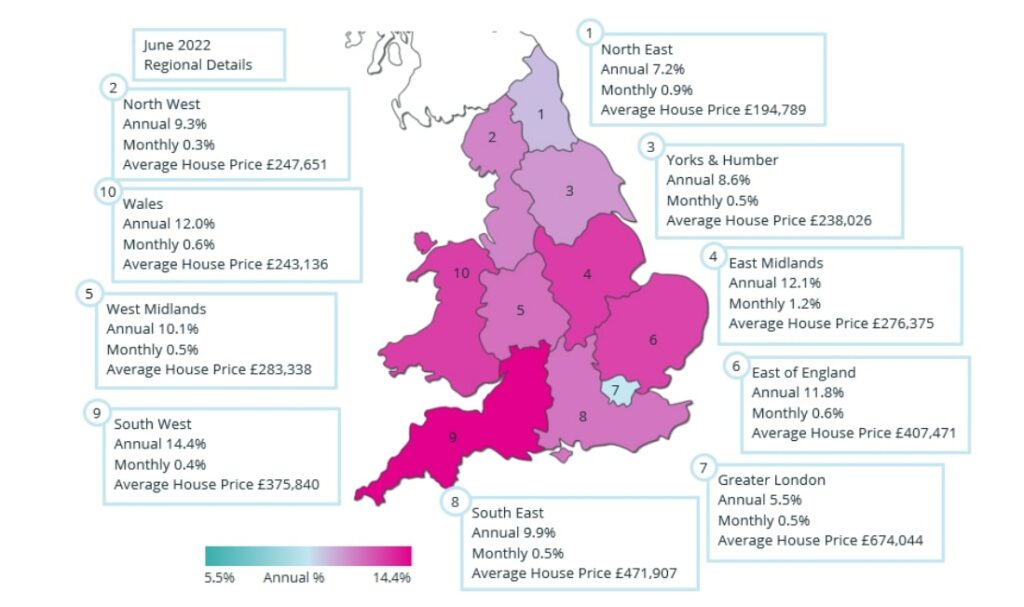
Figure 2 shows the percentage change in annual house prices on a regional basis in England, and for Wales, averaged over the three-month period of May to July 2022, compared to the same three months in 2021. These figures are produced on a rolling three-month basis to smooth out minor changes in price, with Figure 2 showing the similarly-averaged figures from one month earlier.
All ten GOR areas have experienced rising prices over the last twelve months, with eight of the ten areas setting new record average house prices in June 2022. The two exceptions are the North East, where prices in Hartlepool, Middlesborough, Stockton-on-Tees and Darlington fell by -2.1%, -1.2%, -0.8% and -0.3% respectively in the month, and in Greater London, where 7 of the top 10 boroughs by value saw their prices fall in June.
Figure 2 above is showing some remarkable changes in the June 2022 annual growth rates, compared to the previous month. For example, there are six regions in England where annual growth rates between May and June have increased by 4.3%, or more, being the North East, Yorks and the Humber, the North West, the East and West Midlands, and the South West.
These are all areas in England which benefitted strongly from the SDLT tax-holiday. We then have the two English regions of the East of England and the South-East, where the change in the annual rate of house price growth between May 2022 and June 2002 was a somewhat lower 3.1% and 0.3% respectively. Finally, in England, we have the standout of Greater London where the change in rates between the two months was negative, at -2.5%, i.e. prices fell.
To understand why this happened it is worth considering the following graph:-
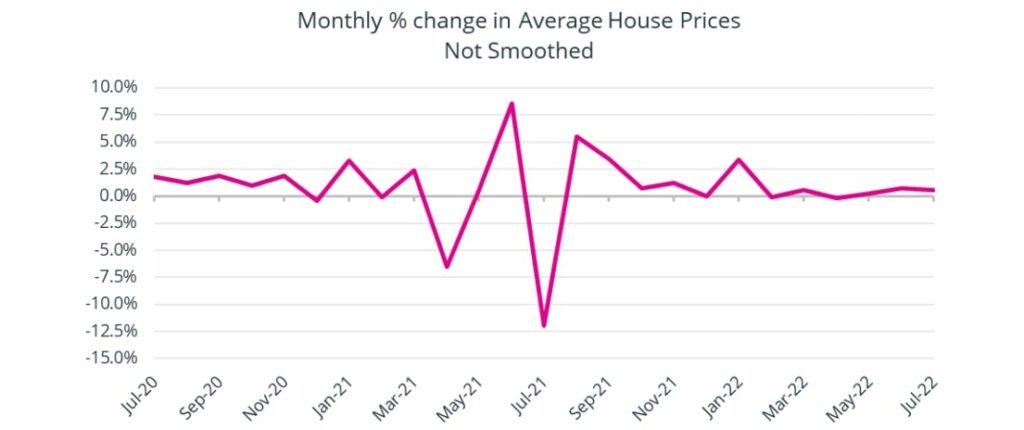
Figure 3 shows the monthly % change in the average house price for England and Wales for the two years from July 2020 to July 2022. Ignoring, for the time being, the small rise in prices in January 2022 – we believe we will receive further data from the Land Registry in the near future which may eliminate this rise – we can see that monthly price growth from October 2021 onward has been relatively stable.
Certainly, there are no dramatic movements in price which might have caused the sizeable changes in the annual price growth of the six GOR areas discussed above.
But what we can also observe in Figure 3 is the dramatic changes in monthly prices during the period from March 2021 to October 2021. March 2021, June 2021 and September 2021 are all SDLT-related events, when the SDLT tax-holiday in England was initially intended to be withdrawn, its extension at the full rate in England to the end of June 2021, and subsequently at its reduced rate in England to the end of September 2021.
There are also two noticeable troughs in prices, which occurred one month after the changes in the SDLT in April 2021 and July 2021, indicating the extent to which buyers were able to bring forward their purchases into a tax-saving month, resulting in lower prices the following month when there were fewer buyers for the more costly properties due to the higher rates of tax being re-applied.
The July 2021 trough is of particular importance to our analysis of the current market, as it provides the base for measuring the annual growth rates over the next twelve months. It is at an “artificially” low level, which has had the effect of enhancing the observed growth in values one year later – despite the observed change in prices in 2022 being relatively small.
Meanwhile in Wales, although it too had an LTT tax-saving scheme in place, it was only on the first £250,000 of a home’s value – as opposed to England’s SDLT scheme applying to the first £500,000 of a property’s value.
The maximum tax-saving in Wales was therefore £2,450 compared to £15,000 in England. The tax saving was thus of less importance in Wales, so the change in price in July 2021, at the ending of the scheme, had less impact than in England.
As a consequence, in June 2022 Wales is no longer at the top of the GOR growth league table, displaced by both the South West and the East Midlands. These regions had risen up the ladder due to the larger downward movement in prices observed twelve months earlier in July 2021.
It is for this reason that Andrew Wishart of Capital Economics, writing about the Nationwide House Price index in July 2022, commented that “Whilst the rise in the annual rate of house price growth from 10.7% to 11.0% in July will make most of the headlines that was driven by base effects. Instead, we think the main takeaway from the July figures is that house prices may already be stalling.”
Our own figures for July 2022 do not actually show a “stall” in prices, but the high increase in the annual rates of growth now shown for the six regions are a result of what happened during May – July 2021. Because these percentages are figures based on a comparison with the same period a year earlier, the July 2022 outcome is all about what was happening some twelve months earlier.
England and Wales Regional Heat Map
These different trends are evident in the Regional Heat Map shown below for June 2022. There are three distinct groupings in England and Wales in terms of house price growth, with the hottest markets in England and Wales having rates in excess of 11.0%, being the South-West (14.4%), the East Midlands (12.1%), Wales (12.0%) and the East of England (11.8%).
We next have a middle tier of regions with price growth between 7.2% and 10.1%, being the West Midlands (10.1%), the South East (9.9%), Yorks and the Humber (8.6%) and the North East (7.2%). Finally in tenth position, we have Greater London (5.5%) – this is a considerable turn-around from the previous month, when London was in fifth place in the league table with growth at 8.0%.
Transactions
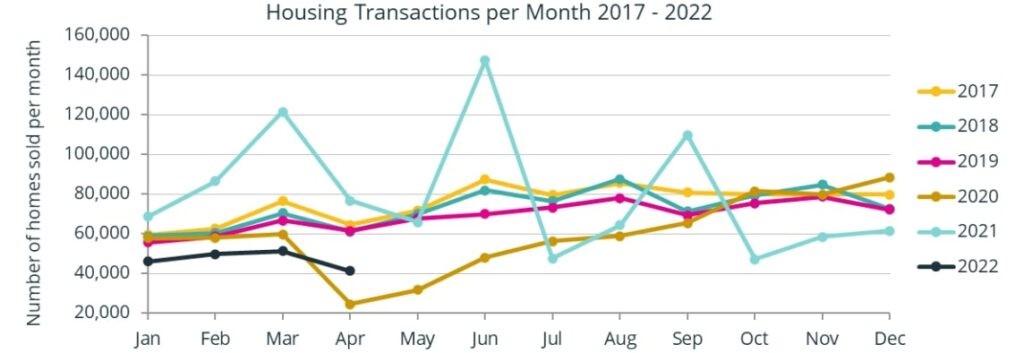
Figure 4 shows the number of domestic property transactions per month recorded in England and Wales at the Land Registry for the period from January 2017 to April 2022.
As the chart shows, the years 2017 – 2019 were relatively normal, with not too many fluctuations from one year to the next.
However, from the start of the pandemic in March 2020, more pronounced changes can be seen in home-buying behaviour, as housing transactions in April 2020 plummeted, to be followed by a return in sales as confidence began to return.
This then developed into a period when sales exceeded previous levels, from October 2020 to September 2021, as lifestyle changes and the SDLT/LTT tax-holidays resulted in an increase in demand, especially for properties with space to allow for working from home.
It is interesting to compare the Figure 4 above, with Figure 3 on page 5, as one can see how the termination dates of the SDLT/LTT tax-holidays and their associated peaks in activity affected both Transactions and Average Prices.
It is difficult to determine whether the apparent lack of sales from October 2021 through to April 2022, compared to previous years, is due to a “true” reduction in sales, or whether this is the result simply of the Land Registry being slow to process the increased number of transactions that took place during June and September 2021. We show the current state of the emerged figures for Q1 2022 and earlier years below.
Comparing Q1 Transactions for 2020, 2021 and 2022, by Region
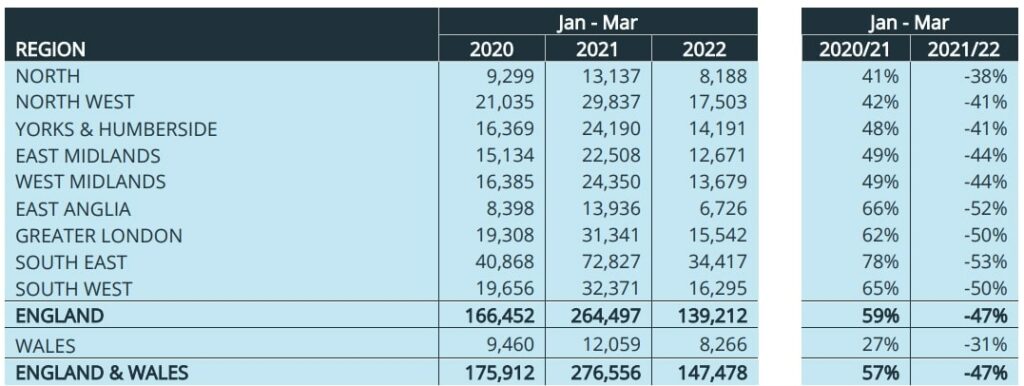
Table 2 shows that in Q1 2020 transactions totalled some 175,900 sales in England and Wales. Q1 2020 would have been largely “Covid free” as the pandemic was not officially announced until March 2020, when most sales for that month would already have been contractually concluded.
The total number of sales during Q1 2021 was 57% higher than in Q1 2020, with this sum being considerably enhanced by the SDLT/LTT tax-holidays in England and Wales, which originally were due to finish by the end of March 2021. In Q1 2022 we see that transactions diminished by 47% from the 2021 total and were also below Q1 2020 levels
It is interesting to note that Wales had the lowest rise in sales, of just 27%, between Q1 2020 and Q1 2021, and also the lowest fall between Q1 2021 and Q1 2022, which is likely to reflect the lower level of savings in the LTT tax-holiday in Wales, compared to the SDLT savings in England.
We can also see from Table 2 that the South East had the largest increase in sales in Q1 2021 compared to Q1 2020, at 78%. This might seem somewhat surprising to those who understood that the change in lifestyle during the pandemic resulted in a movement away from city conurbations to rural areas.
Although such a move was true for a proportion of home buyers, there were also a number who chose to relocate to areas which remained within a reasonable commute of their place of work. Listed below are the ten areas in the South East which saw the largest increase in home sales from Q1 2020 to Q1 2021.
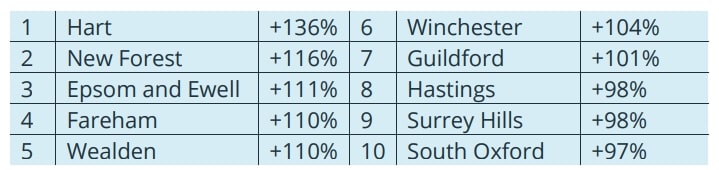
For those unfamiliar with “Hart”, it became a local government district in Hampshire in 1972, being formed by a merger of Fleet and Hartley Wintney district councils. Hart was the winner of the Halifax “Best Quality of Life in Britain” award in 2017