


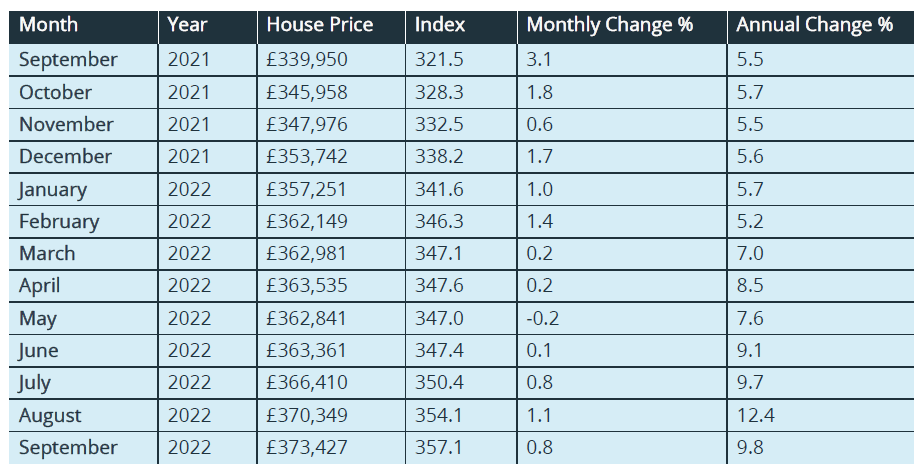
In September all 110 Unitary Authorities in England and Wales saw registered house prices increase with an annual rise of 9.8%, according to e.surv.
London is the only region with any price falls annually, and mainly in its high value boroughs. While Devon saw house price growth of 25%.
Overall the average house price in England and Wales now stands at £373,427, up 0.8% from August.
Richard Sexton, director at e.surv, said: “Our data, taken across all residential property transactions, harks back to a market that predated the Chancellor’s mini budget.
“The average price paid for a home in England and Wales in September 2022 was £373,427, up by some £3k on the revised average price paid in August.
“From March 2020 to the end of August 2022, the average price paid for a home has increased by 18.1%, which contrasts with the increase in consumer price inflation (including housing – CPIH) of 12.2% over the same period. Property prices thus rose in real terms.
“But this was in advance of the new Chancellor’s intervention which has significantly disrupted the supply of mortgage finance. The upward repricing in the funding and derivatives markets has fed through to a rise in all rates but particularly fixed rate loans that account for 80 per cent of mortgage lending.
“The housing market may be driven by sentiment, but we should remember that desirable residential property is still in short supply which will support prices. We continue to enjoy full employment, and we do not know yet what further fiscal rabbits the Chancellor will pull out of his hat in his November statement to relieve the pressure on mortgage pricing.
“A watching brief has shown time and again that the UK housing market has proven remarkably resilient over recent months, and it may yet weather this particular storm too.”
Table 1. Average House Prices in England and Wales for the period September 2021 – September 2022
Commentary: John Tindale and Peter Williams, Acadata senior analysts
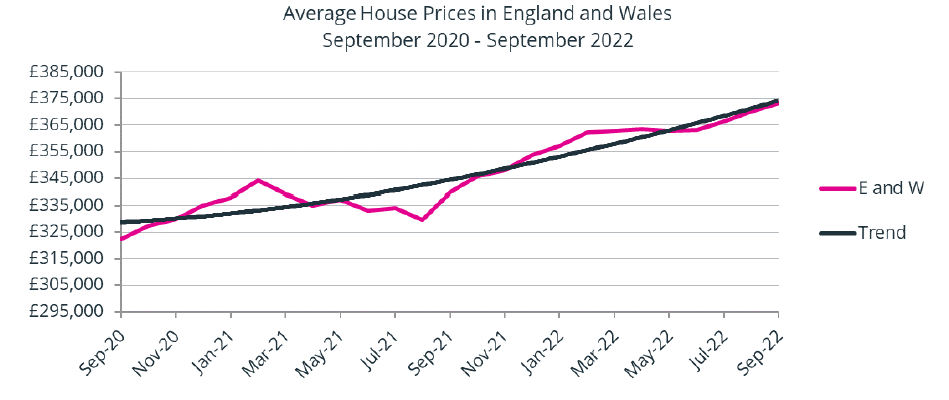
Figure 1. The average house price in England and Wales, smoothed, September 2020 – September 2022
In her speech on 5th October to the Conservative Party conference, the Prime Minister commented: “These are stormy days”. Well, somewhat surprisingly, the data for September’s housing market is still showing that we were in “The calm before the storm”, and what we now know – following the Mini Budget on 23rd September – highlights the lag between the data and the new reality. The housing market in September as a whole continued to function in line with the previous two months, with completion prices in the month, based on both cash and mortgage transactions, increasing by 0.8% – the same growth level as in July 2022.
The average price paid for a home in England and Wales in September 2022 was £373,427, up by some £3k on the revised average price paid in August. From the start of the pandemic in March 2020 to the end of August 2022, the average price paid for a home has increased by some £56,750, or 18.1%, which contrasts with the increase in consumer price inflation (including housing – CPIH) of 12.2% over the same period. Property prices thus rose in real terms.
As Table 1 above shows, September 2022, at 9.8%, had the second highest annual growth rate of the last twelve months, with August 2022, at 12.4% having seen the highest increase. The August rate did however receive a boost in 2022, due to a fall in rates some twelve months earlier – connected with the ending of the generous SDLT tax holiday in June 2021. However, this artificial boost to rates only lasted for a month, so the September statistics are largely showing that the housing market remains at its peak, and is continuing to perform ahead of some analysts’ expectations.
The housing market in September 2022
Any commentary on the state of the housing market in September 2022 and the forward outlook is made more difficult by the impact of the Mini Budget on the 23rd September. As readers will be aware, there was a severe market reaction to these announcements. In terms of the housing and mortgage markets, the pricing and availability of mortgages was disrupted by an upward repricing in the funding and derivatives markets. Many lenders suspended lending and withdrew products. Higher LTV loans were notably impacted, but also fixed rate loans which make up 80% of the market. Confidence and sentiment fell as indicated by the recent BSA survey.
As we have noted in this release, the housing market has shown considerable resilience over recent months, in spite of predictions otherwise. Although interest rates had been edging up – and not least in comparison to average wages – it was clear there was still considerable buying power and appetite in the market. This – in combination with a limited supply of existing homes coming onto the market and the relatively low output of new homes – meant that demand continued to outstrip supply, and prices reflected that.
The question now is how the new balance of factors will work out. There is continued demand in the market, which has also switched from being seller-driven to buyer-driven, resulting in more negotiation on prices. The government’s SDLT and the Wales LTT measures will stimulate further demand and help underpin the market. Set against that are the sharp rises in the price of mortgages and the likelihood that we will see further base rate rises, as the Bank of England seeks to bear down on inflation. As more lenders re-enter the market and restore product ranges, so there will be some easing, but the course ahead does seem set. While most existing mortgage holders are insulated by having a fixed-rate product, as those deals end, so they – along with new entrants to the market – will be facing significantly higher costs and more stretched affordability.
Inevitably, there have been some gloomy predictions about the likely trend in house prices. Many analysts are suggesting a slowing in price growth, with falls in real prices. The key question is whether there will be nominal falls as well. Given the complex web of factors at work, and the fact that there are further announcements to come from the Government (and the Bank), this is more difficult to predict. Our task will be to report on what happens to completion prices based on cash and mortgaged transactions across England and Wales. There will be a lot on which to reflect.
Average Annual Regional House Prices
Figure 2. The annual change in the average house price for the three months from July 2022 to September 2022, analysed by GOR
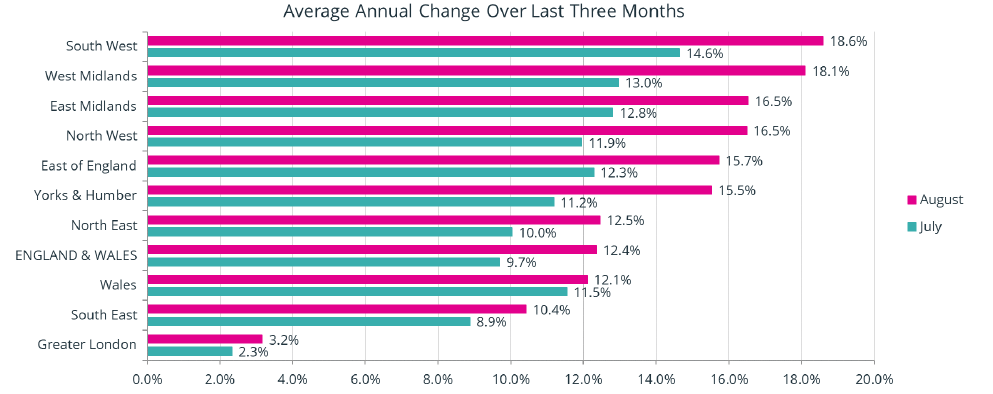
Figure 2 shows the percentage change in annual house prices on a regional basis in England, and for Wales, averaged over the three-month period of July to September 2022, compared to the same three months in 2021. These figures are produced on a rolling three-month basis to smooth out minor changes in price, with Figure 2 showing the similarly averaged figures from one month earlier.
All ten GOR areas have experienced rising prices over the last twelve months, with nine of the ten areas setting new record average house prices in August 2022. The one exception is Greater London, where prices are £4,240 below their peak in February 2022.
Figure 2 above reveals some remarkably high levels of house price inflation in the August 2022 growth rates, with nine of the ten GOR areas seeing price rises in excess of 10%, although as noted above these figures have been assisted by rates being lower than usual twelve months earlier – a consequence of the termination of the highest rate of stamp duty savings in England and the LTT tax holiday in Wales in June 2021.
The South West remains top in August in terms of house price growth (Figure 2) at 18.6%. Within that region, Devon has led the way, with annual price growth of 25.5%. This is also the highest rate of all 110 Unitary Authorities across England and Wales. Devon is followed by Bournemouth, Christchurch and Poole as being the second highest Unitary Authority in England and Wales at 24.0%, which in turn in the South West is followed by Bath and North East Somerset at 21.7%. Interestingly, Cornwall has the lowest growth rate in the South West, of 12.5% in August, but this may be due to a lack of suitable properties being available for sale after a year of high demand.
The West Midlands is in second place in Figure 2 above, its highest position in the league since June 2020, with Worcestershire experiencing the highest annual price growth in the region of 21.3%, followed by Shropshire and the West Midlands (Birmingham) in equal second place with growth of 19.1%. Seven of the eight Unitary Authorities that constitute the West Midlands region are currently setting record prices.
Meanwhile, by way of contrast, Greater London has an overall annual growth rate of just 3.2%, with only 23 of the 33 London boroughs seeing prices rise on an annual basis. Of the ten boroughs with falling values over the last twelve months, seven are in the top ten boroughs in terms of their average values. For example, in the City of Westminster, which is ranked in second place in London in terms of its average value, house prices have fallen by -18.0% over the last twelve months, while in Kensington and Chelsea – the most expensive borough in London – prices fell by -15.5% over the same period. Enfield, which is currently ranked as the 21st borough in terms of its average house price, had the highest annual house price growth rate in August of all 33 boroughs at 19.2% – Enfield has one of the highest proportions of terraced properties, as well as one of the lowest proportions of flats in its housing stock of all 33 London boroughs.
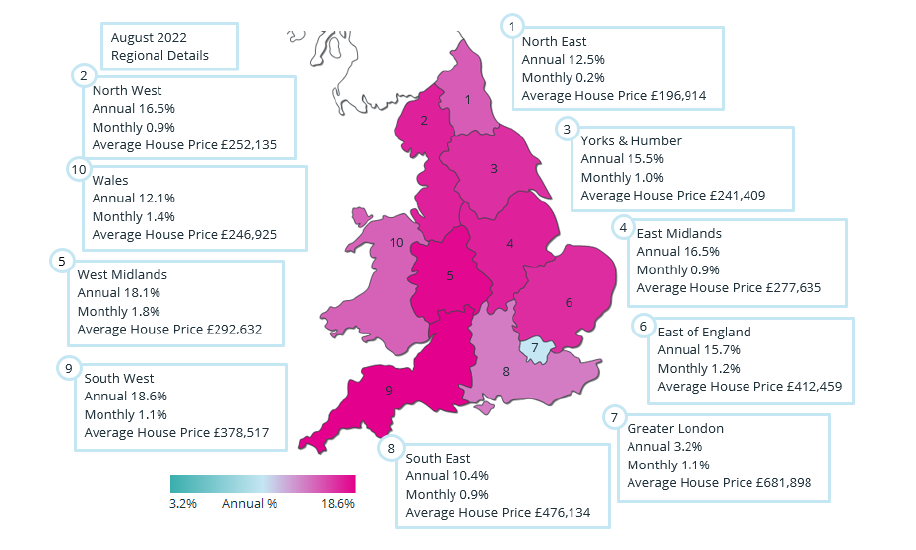
England and Wales Regional Heat Map
These different trends are evident in the Regional Heat Map shown below for August 2022.
There are three distinct groups in England and Wales in August 2022 in terms of house price growth, with six of the ten GOR areas in England and Wales having rates in excess of 12.5%, which are shaded in the deeper reds on the Map. There are then three areas with rates between 10.4% and 12.5%, being the North East, Wales and the South East, listed in descending order. Finally there is Greater London, out on its own, with an annual rate of just 3.2%, for the reasons discussed above.
Annual Growth Rate
The annual growth rate in the average house price for England and Wales in September 2022 was 9.8%. This is the second-highest annual rate for England and Wales since September 2014, with the highest rate, of 12.4%, having occurred one month earlier in August 2022 – but of course for particular reasons. One could perhaps argue that September 2022 has the highest unassisted rate since the start of the pandemic.
We know that the housing market typically lags economic events by one-to-two months. There is a natural delay between the time of making an offer for a property and the completion date of the sale agreement, during which the paperwork and conveyancing are undertaken. Recently, Rightmove has noted that the delay in purchasing a property has extended on average to over 100 days. If correct, our “September” market may in fact be reflecting events that took place in June 2022.
For the record, in August 2022, all 110 of the Unitary Authorities / Metropolitan Counties in England and Wales that we monitor for this index had an upward movement in prices over the previous twelve months, ranging from +25.5% in Devon to +1.7% in Windsor and Maidenhead. It was only in Greater London that 10 boroughs saw prices fall over the same period. Overall in Greater London, average price movements ranged from +19.2% in Enfield, to -27.2% in the City of London.
Monthly Growth Rate
The monthly growth rate in the average house price for England and Wales in September was 0.8% – the same as in July 2022, with August having an increased rate of 1.1%. The August monthly rate was the second highest of the calendar year, behind February, with the September rate being ranked the fifth-highest month – perhaps being the only statistic in the September data which does not claim to be the best of the calendar year.
For the record, in August 2022, 93 of the 110 Unitary Authorities / Metropolitan Counties in England and Wales saw prices increase in the month, which was 8 more areas than in July 2022. The largest increase in the month was in Halton, at 4.7%, followed by the Vale of Glamorgan at 3.6%. The largest fall in August was in Gwynedd, where prices fell by -2.9%. It is noticeable in Gwynedd that the price of detached homes fell as the summer season progressed, suggesting that many of the prime detached homes in the area have been bought as holiday homes – or holiday lets – with the urgency for buying such premises diminishing as the summer season draws to its end.
All 10 GOR areas in England and Wales saw prices increase during August 2022, with the largest monthly increase of 1.4% being in Wales. The highest increase in Wales in the month was in the Vale of Glamorgan, up by 3.6%. Interestingly, in the Vale of Glamorgan it was semi-detached homes that saw the largest increase in prices in the month, with resplendent Victorian properties in Penarth helping to raise the average price. Penarth is an elegant seaside town located some 4 miles to the south of Cardiff city centre, with a 12-minute train journey to Cardiff Central Station.
Transactions
Figure 3. The number of housing transactions per month, January 2007 – August 2022
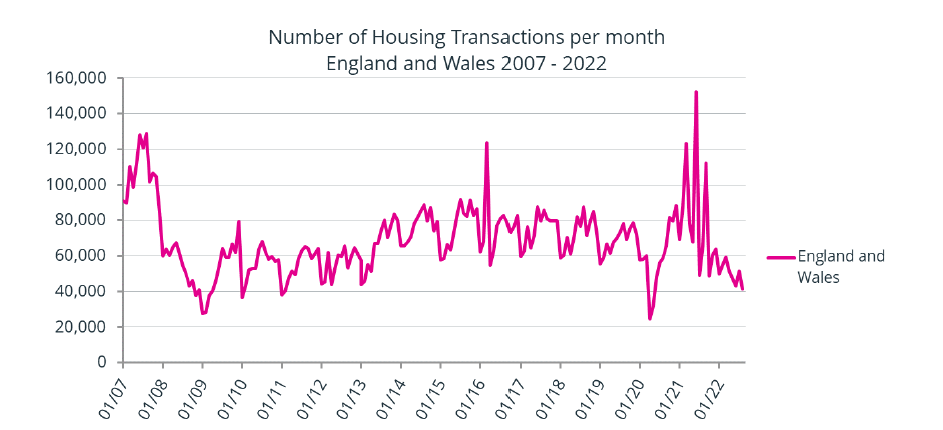
Figure 3 shows the number of domestic property transactions per month recorded in England and Wales at the Land Registry for the period from January 2007 to August 2022.
As the chart indicates, the years 2013 – 2019 were relatively “normal”, with only the spike in sales in March 2016 – one month ahead of the additional 3% SDLT on second properties – upsetting the usual seasonal patterns that were then prevalent. However, from the start of the pandemic in March 2020, the market becomes notably more volatile as housing transactions in April 2020 plummeted due to the arrival of the pandemic, to be followed by a slow rise in sales as confidence began to return. Then followed a period when sales exceeded previous levels, from October 2020 to September 2021, as lifestyle changes and the SDLT/LTT tax-holidays pushed up demand, especially for properties with space to allow for working from home.
Having experienced three tax-related peaks in 2021, transactions from October 2021 through to August 2022 have been running between 40,000 and 60,000 per month. This is below the pre-pandemic norm, at approximately half of the levels seen from January 2017 to December 2019. However, we should note the current delays in processing transactions at the Land Registry. The gap in numbers between the latest months and the pre-pandemic levels will be reduced as further sales are processed by the Land Registry.
Transactions by region
Table 2. Transaction counts for the SSR regions. comparing Q2 2019, Q2 2020, Q2 2021 and Q2 2022
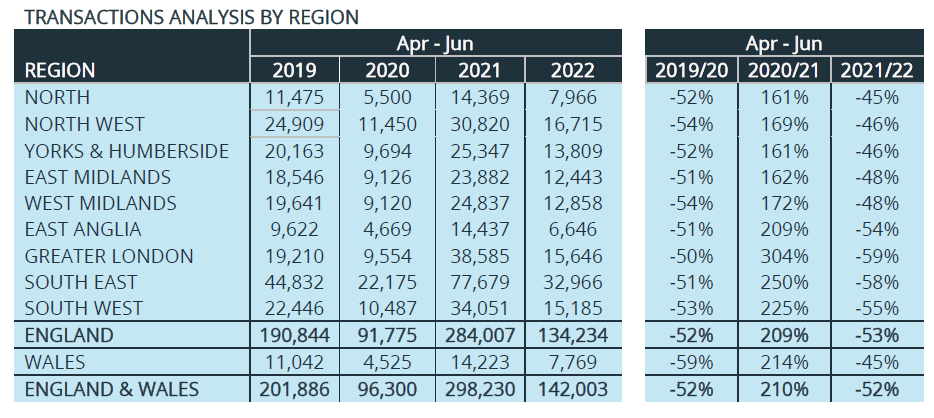
Table 2 compares the transaction counts for Q2 2019, Q2 2020, Q2 2021 and Q2 2022, in England and Wales, analysed by Country and SSR region.
As can be seen, the lowest transaction counts are associated with Q2 2020, which reflects the period from April 2020, the first full month from the start of the Pandemic (in March 2020) to June 2020. Sales during this quarter were at a near all-time low. and were generally close to half of the sales achieved during the same quarter in 2019. The reduction in sales in Wales in Q2 2020 was the largest at -59% of Q2 2019 sales, with the smallest reduction being seen in Greater London at -50%.
Moving onward to Q2 2021, there is a general improvement in sales from the previous year, with transaction counts largely tripling the levels to which sales had fallen in Q2 2020. It is important to recall that Q2 2021 includes the data for June 2021, which was the last month in which the full SDLT / LTT tax holidays applied in both England and Wales. During this last month of the full tax holiday, there was a general scramble amongst property buyers to complete their purchases before the tax holiday reverted to a less generous level – the peak in sales relating to June 2021 is clearly visible in Figure 3 above.
It is interesting to note that in Q2 2021, the highest increase in sales occurred in Greater London (+304%) and the South East (+250%). The general belief at the time was that this sales activity was a product of an exodus of residents from London and the South East into larger properties in more rural and coastal locations, associated with an improvement in living conditions brought about by “working from home” and the “race for space”. Clearly, these considerations did exist, though in practice a large number of London residents actually moved to more leafy suburbs within Greater London, such as Kingston upon Thames, or moved to commuter towns in the South East region, such as Virginia Water, Woking, Epsom and Tunbridge Wells.
Finally, we can see from Table 2 that transactions in Q2 2022 are generally only half the levels seen in Q2 2021, but remain above the lows of Q2 2020. Overall Q2 2022 achieved 70% of the level of sales seen in Q2 2019.
Transactions by property type
Figure 4. The number of housing transactions per month, January 2007 – June 2022, analysed by property type
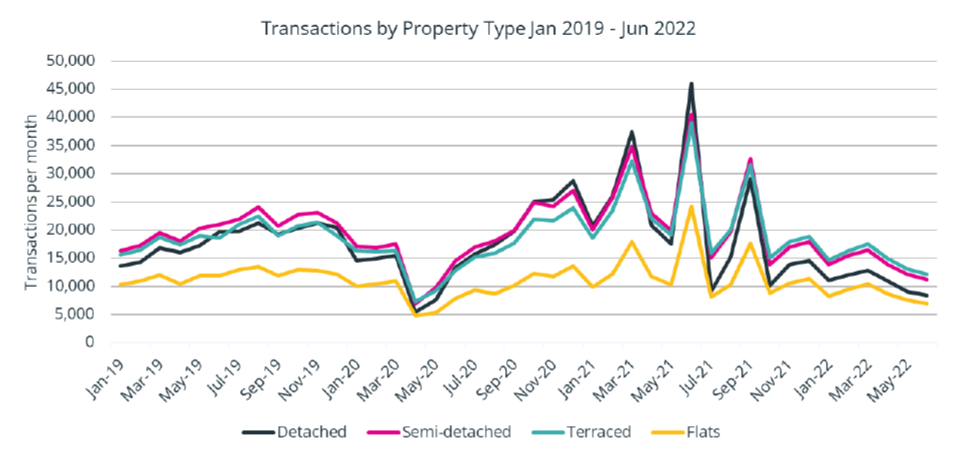
Figure 4 above analyses transactions for the period from January 2019 to June 2022 by property type. In general we can see that transactions by each property type tend to move in similar directions to each other, with peaks and troughs tending to occur in the same months.
However, on closer examination we can see that during 2019 and the first three months of 2022, the ranking order in sales totals starts with semi-detached, followed by terraces, detached and finally flats. However, from October 2021 onward this changes, with terraces outnumbering semi-detached sales, and the number of detached sales being visibly smaller than semi-detached during this latter period. Meanwhile, flats continue to trail the other three property types. Is this reduction in the number of detached sales a function of a reduction in the number of available properties for sale, as we suggested earlier when looking at the sales currently taking place in Cornwall? Or is the reduction in the sale of detached properties the result of a tendency of detached owners to remain in their homes for longer periods?
Table 3. Transaction counts by Property Types. comparing Q2 2019, Q2 2020, Q2 2021 and Q2 2022
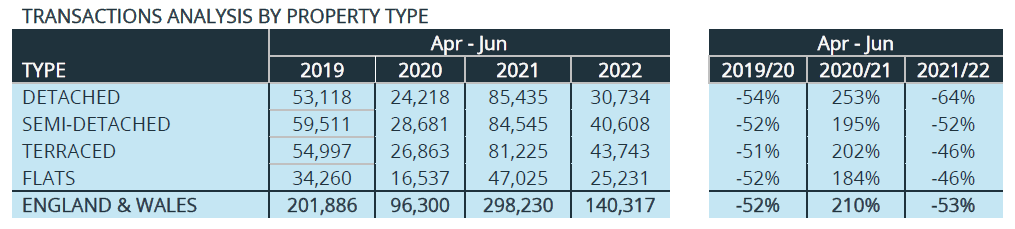
Table 3 is analysed by property type, as opposed to the Standard Statistical Regions listed in Table 2.
The fall out in transaction numbers that occurred at the beginning of the pandemic, illustrated in Table 3 by the change from 2019/20, shows that all property types saw a similar fall in transaction numbers as the pandemic took hold, at around – 52%.
But looking at the change from Q2 2020 to Q2 2021, which includes the “peak” month of June 2021, there have been substantial differences in performance. Sales of detached properties increased by 253%, while flats only increased by 184%. This is in line with the “race for space” theory – although as we indicated above, much of this increase in property sales took place in the South East of England and within Greater London itself. Interestingly, sales of terraced properties over this period increased by a larger percentage than that of semi-detached homes – but this may have occurred as a result of there possibly being more new-build terraces (or “town-houses”) available, compared to semi-detached homes.
Finally, during this latest year, the Table shows that the sales of terraced homes and flats fell by the same amount, when measured in percentage terms, with semi-detached homes and detached properties seeing the largest reduction in sales. As suggested above, this may be a function of households staying longer in these types of property (the top of the ladder) – indeed, few of them would have been put on the market since their purchase in the summer of 2021.