House prices have increased in all 32 Scottish Local Authority Areas over the past 12 months with annual growth now standing at 7.6%, Walker Fraser Steele’s latest house price index has revealed.
On the mainland, Argyll and Bute record 22.7% growth in prices yearly while East Dunbartonshire prices rise by 5.4% in April.
Aberdeenshire saw the largest gains while the average Scottish house price is now £218,394, up 0.5% on March and 7.6% annually.
Scott Jack, regional development director at Walker Fraser Steele, said: “Records were made to be broken as the saying goes and the evidence of this month’s data supports that.
“All 32 local authority areas in Scotland have seen property prices rise on an annual basis. The last time we witnessed this was in March of last year – a month before Holyrood withdrew the Land and Buildings Transaction Tax holiday it had introduced to support the market in July 2020.
“While that support was rightly targeted at keeping the housing market functioning during the early months of the pandemic, what is evident now is that people are still looking to move but that a lack of the right kind of stock is supporting prices across the country.
“Our index shows that the average house price in Scotland has increased by some £15,500 – or 7.6% – over the last twelve months, to the end of April. This is a £2,400 increase over the revised £13,100 growth in prices seen in the twelve months to the end of March 2022.
“The average price paid for a house in Scotland in April of this year is £218,394, setting yet another record price for the country – the tenth occasion that this has happened in the last twelve months.
“This price is some £15,500 higher than that seen in April 2021, meaning that prices have risen by 7.6% on an annual basis. This annual growth rate is the highest recorded to date in 2022.”
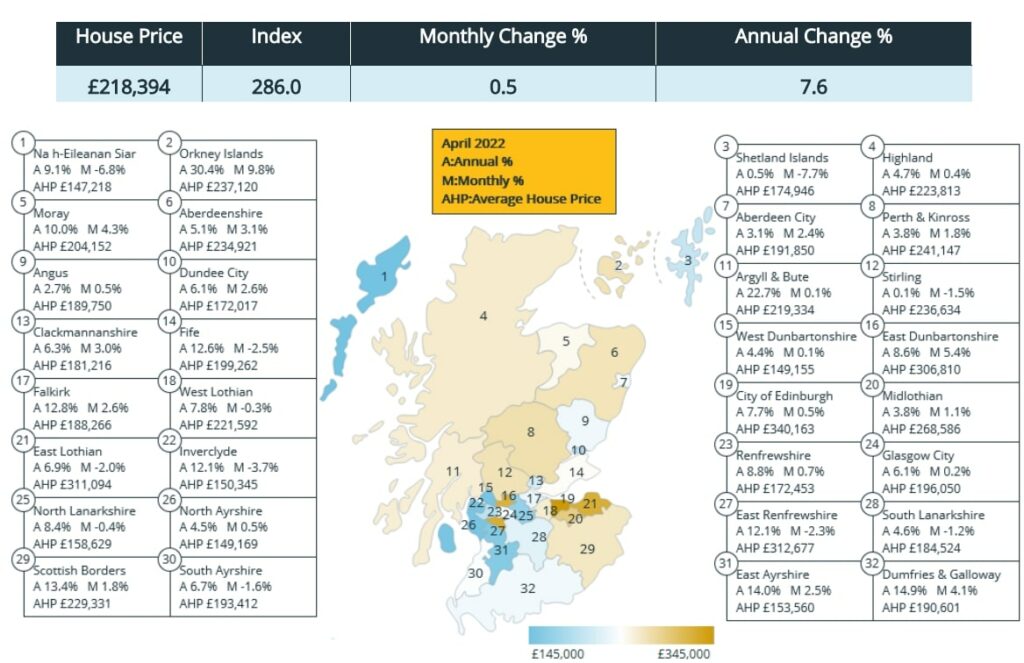
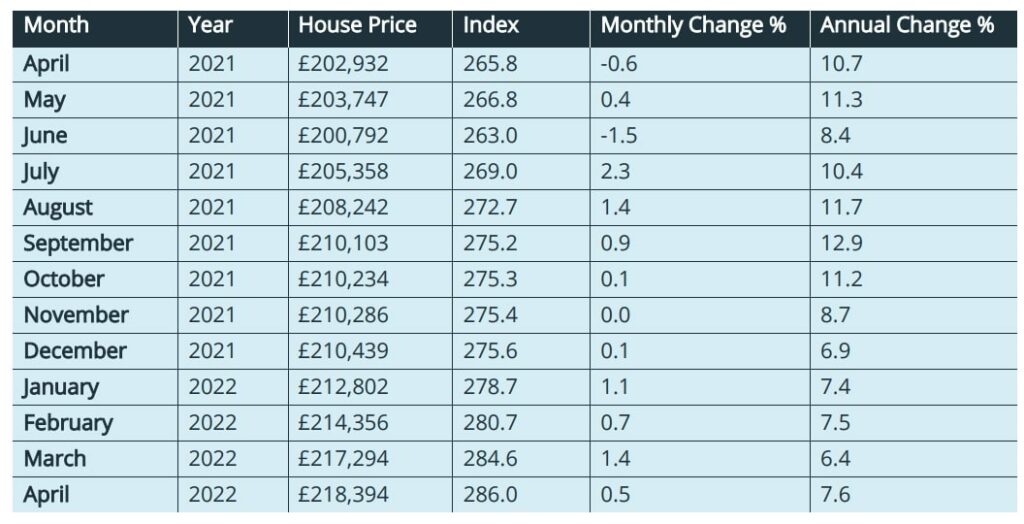
Table 1. Average House Prices in Scotland for the period April 2021 – April 2022
Commentary: John Tindale, Acadata senior housing analyst
The April housing market: The average price paid for a house in Scotland in April 2022 is £218,394, setting yet another record price for the country – the tenth occasion that this has happened in the last twelve months.
This price is some £15,500 higher than that seen in April 2021, meaning that prices have risen by 7.6% on an annual basis.
This annual growth rate is the highest recorded to date in 2022. All 32 local authority areas in Scotland have seen their prices rise on an annual basis – the last time this happened was in March 2021, being the last month of the LBTT tax holiday introduced on 15 July 2020, as an incentive to keep the housing market in Scotland functioning during the early months of the pandemic.
The ending of the LBTT incentive in April 2021 caused an upward blip in prices in March 2021, as purchasers sought to take advantage of the tax savings that were available before they were withdrawn.
But it also resulted in average prices in April 2021 falling, since most of the high-value properties had been purchased in the previous month. In part, this explains the apparent strong performance in prices in April 2022 – since the starting point for measurement purposes twelve months earlier was from a comparatively low level.
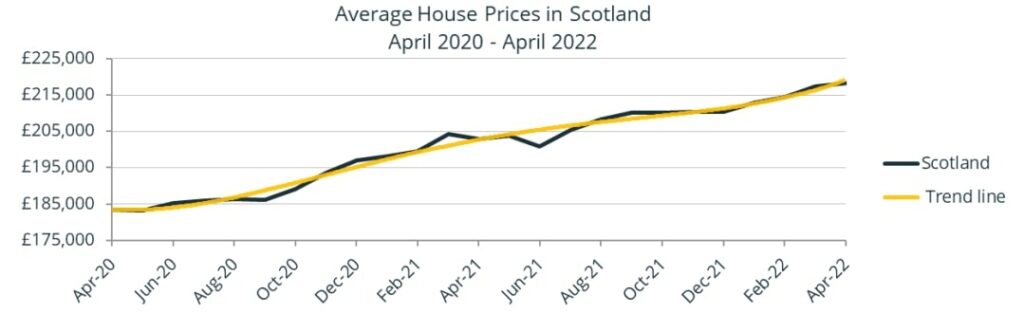
On a monthly basis, prices in April 2022 rose by 0.5%, or close to £1,100. This monthly increase is the lowest recorded in the first four months of 2022. The housing market growth rates would therefore appear to be slowing in April, although as Figure 1 below shows, house prices are continuing to climb, with the slowdown in rates being almost imperceptible on the graph.
Figure 1. The average house price in Scotland over the period April 2020 to April 2022 with trendline
Looking at the England and Wales regional housing markets in April 2022, only Yorkshire and the Humber and the North East had annual growth rates lower than Scotland, at 6.1% and 6.2% respectively.
However, we were able to report in our England and Wales market analysis that the low growth rates seen in the north of England were due to the high rates experienced 12 months earlier – with the same argument being equally applicable to Scotland.
In April of each year, we reset our weights, which marginally re-defines how we calculate the average price paid for a property in Scotland.
This process is described in more detail on pages 9 and 10 of this report. The re-weighting has been applied to all our current and historic data to ensure that comparisons can be made from one year to the next, providing a consistency in approach over time.
Transactions analysis
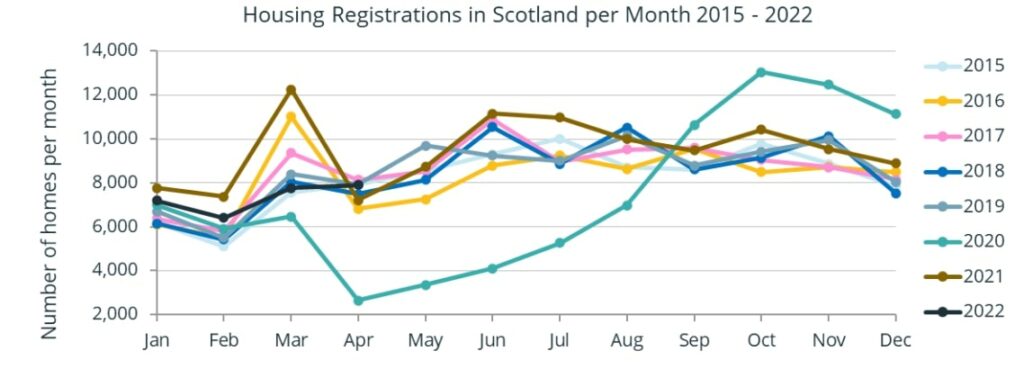
Figure 2 below shows the monthly transaction count for purchases during the period January 2015 to April 2022, based on RoS (Registers of Scotland) figures for the Date of Entry. (April 2022 totals are based on RoS Application dates.) Over the last seven years, sales volumes in April have been lower than in March, except for April 2022 – although this latter total has still to be finalised in terms of the entry date counts.
The April 2022 transaction total – at 7,914 sales – is the fourth-highest April figure of the last ten years. The average sales total for April, excluding April 2020 – at the start of the pandemic – is 7,500 transactions. We can therefore conclude that April of this year, although not exceptional, has sales volumes above the average.
The peak month for sales in Scotland is August, with an average 9.350 transactions, so we can anticipate reporting on a slow build in the number of properties being sold over the next four months.
Figure 2. The number of sales per month recorded by RoS based on entry date (RoS applications date for April 2022), for the period 2015 – 2022. (Source: Registers of Scotland.)
Scotland transactions of £750k or higher
Table 2. The number of transactions by month in Scotland greater than or equal to £750k, January 2015 – April 2022
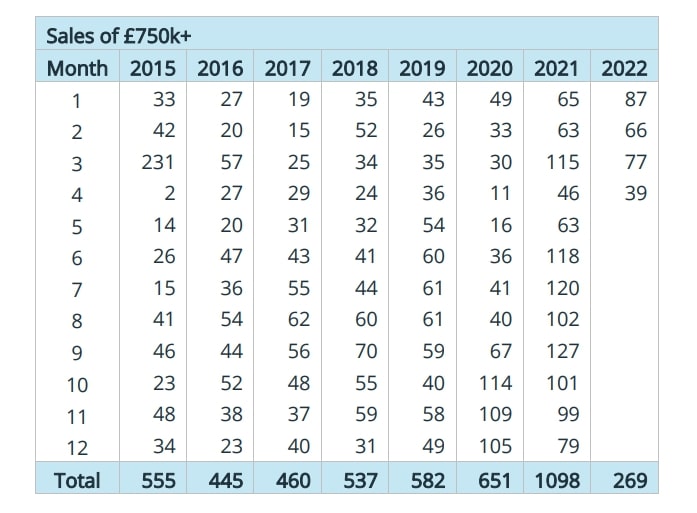
Table 2 shows the number of transactions per month in Scotland which are equal to or greater than £750k. The threshold of £750k has been selected as it is the breakpoint at which the highest rate of LBTT becomes payable
Table 2 shows that there were 39 sales in excess of £750k during April 2022, and we anticipate that this number will increase as further sales for the month are processed by the Registers of Scotland. It is therefore quite likely that, if we exclude March 2021, we can report that in every month in 2022 there has been an increase in the number of properties sold in excess of £750k, compared to the same month from 2016 onward. The reason that March 2021 is excluded from the analysis is that it was exceptional, with sales being enhanced since it was the final month in which purchasers could take advantage of the LBTT tax holiday.
The rise in the number of high-value homes being purchased in 2022 is an indication that the “lifestyle changes” associated with the pandemic arising from “working from home” and the “race for space” are still strong features of the current housing market.
This, as we discuss on page 7, has resulted in strong competition for the properties that meet these requirements, with substantial price rises being seen at the top-end of the market.
The five authorities with the largest number of the 269 high-value sales that have been recorded to date in 2022 are: Edinburgh (139); Fife (16); Glasgow City (15); East Lothian (15); and finally East Renfrewshire (11). It can be seen from these figures that in 2022, Edinburgh accounts for more than half of this sector of the housing market.
Local Authority Analysis
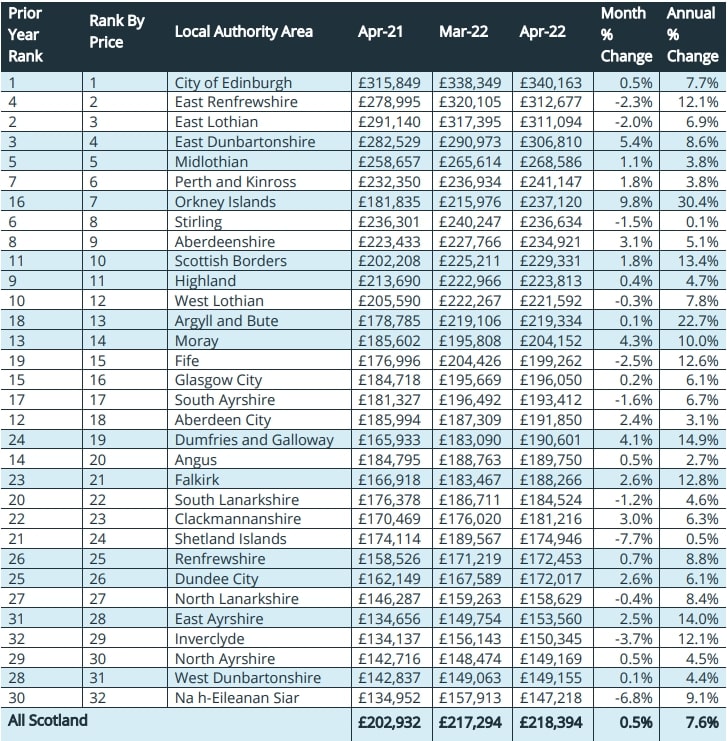
Table 3 above shows the average house price and percentage change (over the last month and year) by Local Authority Area for April 2021, as well as for March and April 2022, calculated on a seasonal and mix-adjusted basis.
The ranking in Table 3 is based on the local authority area’s average house price for April 2022. Local Authority areas shaded in blue experienced record average house prices in April 2022.
Annual change
The average house price in Scotland has increased by some £15,500 – or 7.6% – over the last twelve months, to the end of April. This is a £2,400 increase over the revised £13,100 growth in prices seen in the twelve months to the end of March 2022.
In April 2022, all 32 of the local authority areas in Scotland saw their average prices rise over the levels twelve months earlier – the last time this happened was in March 2021, being the final month of the recent LBTT tax holiday.
The area with the highest annual increase in average house prices in April 2022 was the Orkney Islands, where values have risen by 30.4% over the year, but the small number of transactions that occur on the Islands – just 17 recorded in April – tends to result in volatile movements in average prices, especially when expressed in percentage terms.
On the mainland, the highest increase in average prices over the year was in Argyll and Bute, at 22.7%. The statistics for Argyll and Bute were assisted this month by the sale of a 5-bedroom detached home, located just outside Oban and having a guide price of £485,000. In fact, this property sold for £600,000 – an example, perhaps, of how strong competition for the right home is tending to increase prices across the country.
On a weight-adjusted basis, which employs both the change in prices and the number of transactions involved, there are five local authority areas in April that account for 44% of the £15,500 increase in Scotland’s average house price over the year. The five areas in descending order of influence are: – Edinburgh (17%), Fife (10%); Glasgow (8%); Argyll and Bute (5%); and North Lanarkshire (4%).
Monthly change
In April 2022, Scotland’s average house price in the month rose by some £1,100, or 0.5%, which is a third less than the near £3,000 increase seen in March. The average price in Scotland now stands at £218,394, which sets a record level for the nation for the tenth time in the last twelve months.
In April 2022, 21 of the 32 Local Authority areas in Scotland experienced rising prices in the month, three higher than one month earlier. The largest increase in average prices in April – of 9.8% – was also in the Orkney Islands, where the average price of detached homes increased from £211k in March to £238k in April.
On the mainland, the largest increase in prices was in East Dunbartonshire, where values rose across all property types except for semi-detached homes. Sales in the area in April included a £2.2m detached home in Bearsden, which is a town located approximately six miles to the north-west of Glasgow. It is the most expensive property to have been sold in East Dunbartonshire since August 2018.
Peak Prices
Each month, in Table 3 above, we highlight in light blue the local authority areas which have reached a new record in their average house prices. In April there are 14 such authorities, one more than in March. We can also add that Scotland itself has set a record average price in April 2022 – the fourth of this calendar year.
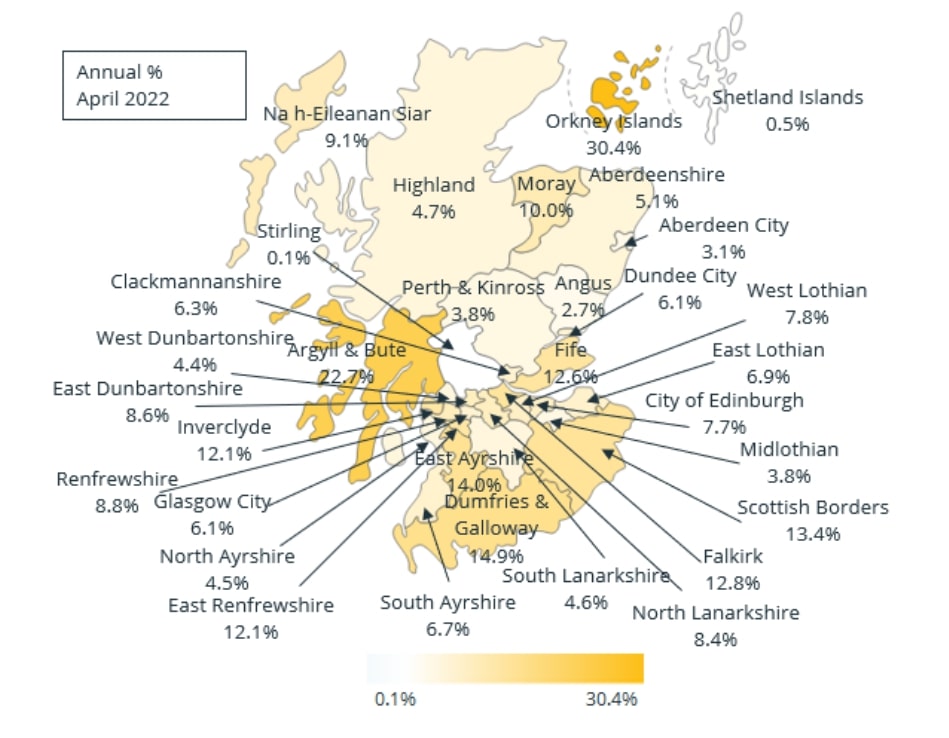
Heat Map
The heat map below shows the rate of house price growth for the 12 months ending April 2022. As reported above, all 32 local authority areas in Scotland have seen a rise in their average property values over the last year. The highest increase over the twelve months to April 2022 was in the Orkney Islands at 30.4%, followed by Argyll and Bute at 22.7%.
Change in mix and seasonal adjustment
This month we have updated the mix and seasonal adjustment that we use to calculate the average house price for Scotland. It is the House Price Index equivalent of changing the basket of goods that make up the calculations for the Retail Price Index. The purpose in updating the mix and seasonality is to ensure that our average prices continue to reflect current market behaviour.
Over the last year, the Walker Fraser Steele Acadata HPI (Scotland) has been based on a weighting of property type and location given by the number of housing transactions that took place in Scotland between April 2018 and March 2021, some 294,730 in number. This mix of property type and location has been kept constant over the last year to enable a comparison of prices to take place.
We have recalculated these weights to reflect the transactions that took place in Scotland between April 2019 and March 2022, i.e. one year later, which comprise some 303,592 in number.
We summarise the differences in these changes in Tables 4 & 5 below. We have subsequently recalculated all our various house price series based on the new weightings and seasonality, which has had the effect of decreasing the average house price in Scotland in March 2022 by £2,580
Figure 3. Average House Prices in Scotland, March 2017-2022, comparing values using new & old weights
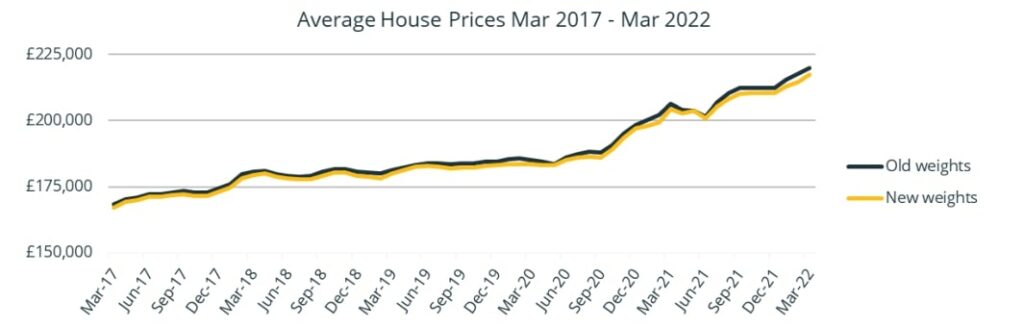
As can be seen from Figure 3, the movements in the average value of house prices using both the new and old weights match closely, with a general downward shift in prices over the period associated with the new weightings. The new weights have reduced average prices over the last five years by between £130 and £3,360 compared to the old weights, with the 2021/2022 observations showing the largest differences in price, averaging £1,840 over the twelve months from April 2021 to March 2022.
Table 4. The change in the Walker Fraser Steele Acadata Scotland HPI weights 2019 vs 2018 by property type
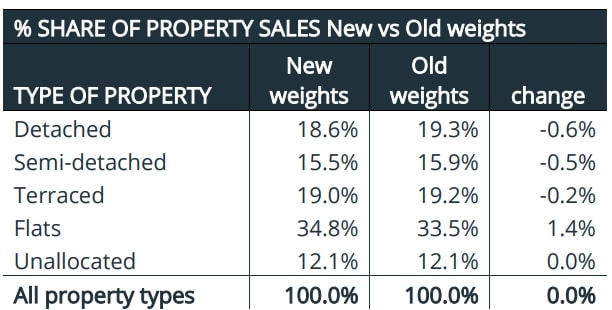
As can be seen from Table 4, the market shares of detached, semi-detached and terraced properties in Scotland’s housing market have all decreased over the period by between -0.2% and -0.6%, with a rise of 1.4% in the share of flatted properties. Typically, the term ‘unallocated’ relates to building plots for new-build ‘off-plan’ properties, where the property type of the home to be constructed has not been officially recorded.
In addition to the change in the mix of property types, we have also changed the weights relating to each Local Authority area, which are shown in Table 5 below.
In the table we have highlighted the six areas with the largest increases and the five areas with the largest decreases in market share over the period. The major gain has been seen in Aberdeenshire, up by 0.3%, with the major loss being seen in North Lanarkshire, down by 0.2%.
Table 5. The change in the Walker Fraser Steele Acadata HPI (Scotland) weights 2019-2022 vs 2018-2021 by local authority area
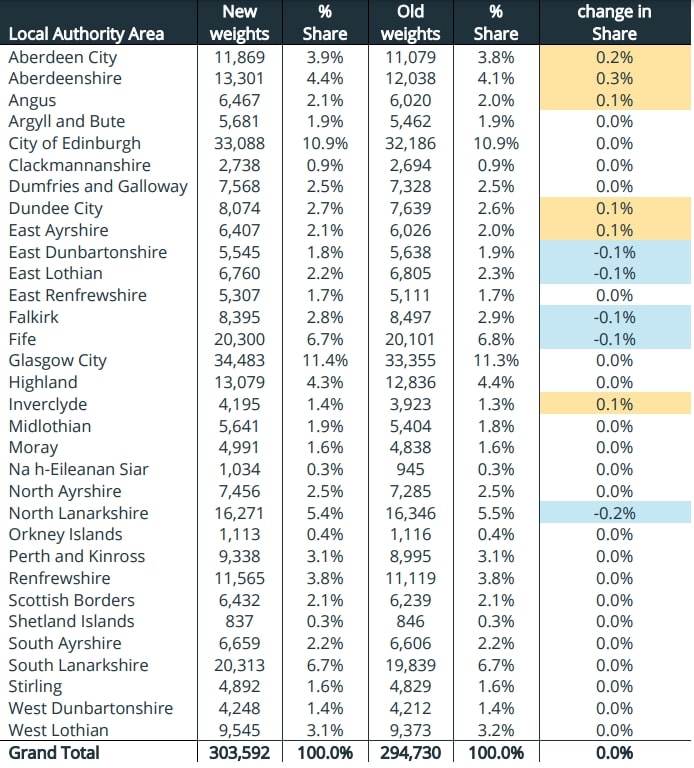
Using the new weights, Glasgow and Edinburgh now account for 22.3% of Scotland’s housing market, up by 0.1% over the preceding year.
Comparisons with Scotland
Figure 4. Scotland house prices, compared with England and Wales, Wales, North East and North West for the period January 2005-April 2022
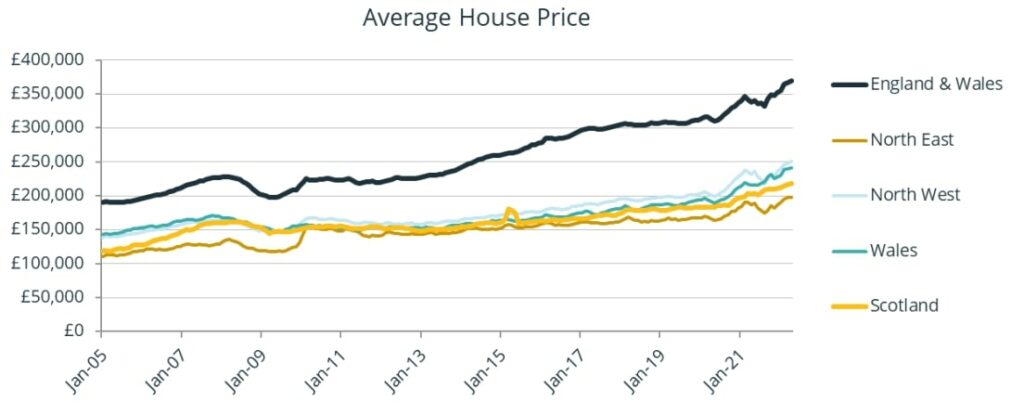
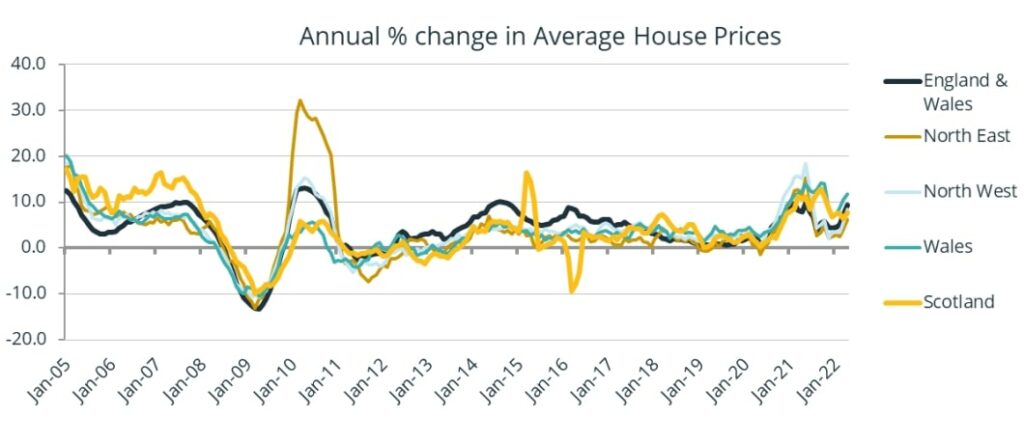
Figure 5. A comparison of the annual change in house prices in Scotland, England and Wales, Wales, North East and North West for the period January 2005–April 2022
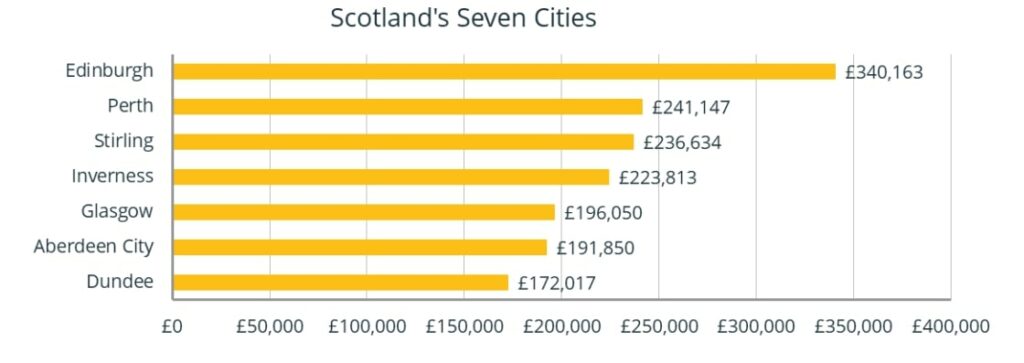
Scotland’s Seven Cities
Figure 6. Average house prices for Scotland’s seven cities from January 2021–April 2022
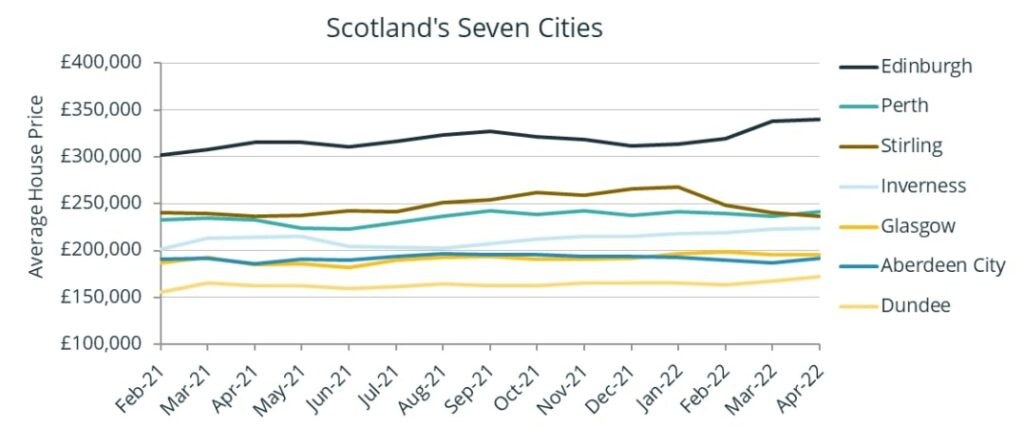
Figure 7. Average house prices for Scotland’s seven cities April 2022