


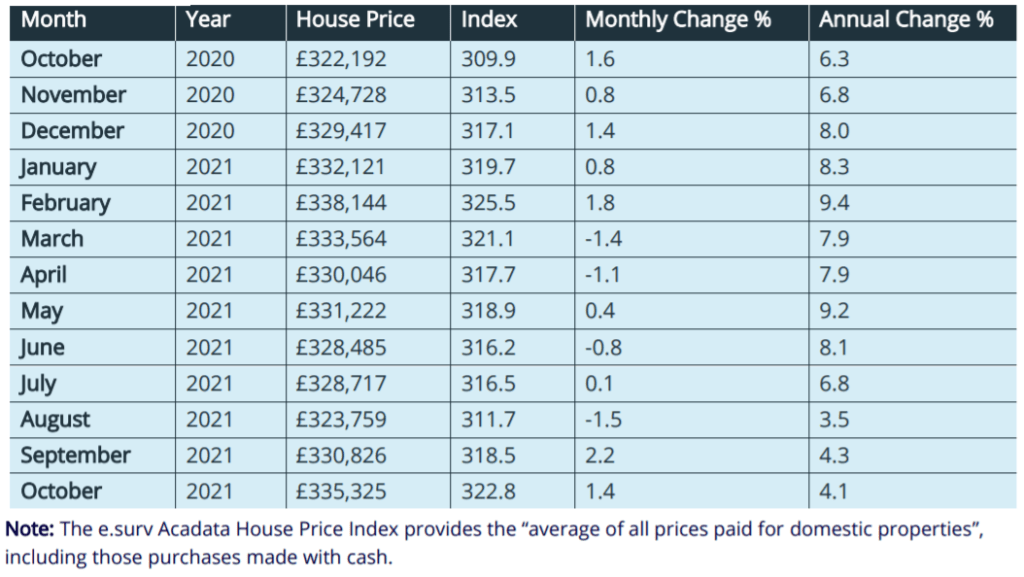
Annual house price growth across England and Wales slowed to 4.1% in October, but some hotspots such as Blackpool saw substantial gains with prices up 16.9% year on year, the latest index from e.surv revealed.
At a national level, the average house price reached £335,325, up by 1.4% from September.
Wales saw the strongest increases, with prices up by 10.8% compared to October 2020, reaching an average of £220,582.
The North West also continued to outperform, with prices up by 6.9% year on year.
London growth remained the weakest of any region, with prices up by 1.9% compare to last year, reaching £651,901.
But prices in the capital dipped by 0.5% compared to September.
Richard Sexton, director at e.surv, said: “The complexity of the UK residential property market is evident in the varying regional performance. It aptly illustrates why talk of national average house prices can be unhelpful at a micro-level. While Wales continues its strong performance annually, regional annual house price performance in England has revealed that the north-west, and within it specifically Blackpool at a staggering 16.9%, has comfortably out-performed the rest of the country. This means that for five of the last eight months the North West has been at the top of our regional league table in terms of having the highest rates of annual house price growth and it continues to have the highest rate of growth of the nine regions in England.
“The factors that have spurred the growth seen in Blackpool also affect other areas in the region. Warrington and Merseyside had the second- and third-highest growth in the North West over the year. All property types in these areas saw an increase in values over the year, but especially the prices of semi-detached homes which were up by £25,000 and £16,000 respectively.
“At a macro-level, the decision this month to hold interest rates will support buyers considering a home-move imminently and with a voting margin of 5-2 to hold, there is speculation that it is unlikely we will see any rise before the first quarter of 2022. The Bank of England is clear that it expects inflationary pressures to lessen – National Insurance tax rises due in April next year may already be having a desired effect. The Office for Budget Responsibility is now forecasting low but positive rates in 2022 and into 2023, with a steady increase in subsequent years which means borrowers should feel confident about buying – particularly with continued government support for 95% LTV lending which will support prices.”

John Tindale and Peter Williams, Acadata senior analysts, added: “This commentary starts by exposing the significant price volatility that has been evident in the England and Wales market in 2020 and 2021. Figure 1 above tracks the movement in the average house price for England and Wales on a month-by-month basis over the last two years without any of our normal smoothing of the data, so that actual monthly variations are made more obvious.
“House prices fell in March 2020 at the start of the pandemic. In part this was due to the first government ‘lockdown’, which restricted buyers from visiting prospective properties, and in part due to a lack of consumer confidence in what might happen in the future. However, by June some confidence had returned to the economy, and the government had relaxed the rules relating to property visits. House prices began to recover, being assisted considerably by the stamp duty holiday, introduced from 8 July 2020, as well as by the lifestyle changes associated with working from home. This resulted in a significant shift in housing preferences to larger properties – with additional space for home working.
“The recovery in the housing market continued from June 2020 to December 2020 with competition for larger homes widely manifest and prices rising as a consequence. There was a slight flattening in prices in December 2020 – the cancelled ‘lockdown’ Christmas – but then taking off again to reach a first peak in March 2021, coinciding with the scheduled date for the ending of the stamp duty holiday. This end date was subsequently extended to June in Wales and to September in England, albeit at a reduced rate.
“As the graph shows, there was a steep reduction in prices after the March and June peaks – arising from a process known as ‘forestalling’. This results in buyers bringing forward the purchase of high value properties into the month with the largest tax savings – this then being followed by one or two months in which relatively few high value sales took place, thus causing the average house price to fall, and hence explaining the dip in prices in April, May and July and August 2021.
“In September, prices rose by 2.2% in the month, reflecting the last opportunity for buyers to take advantage of the SDLT tax-holiday in England which ceased at the end of the month. On an annual basis, house prices in September rose by 4.3%. Hopefully some of this price volatility will now drop out of the market.
October – Annual and Monthly Price Trends
“Returning to our normal smoothed figures, the average price of all completed sales funded by both mortgages and cash grew at an annual rate of 4.1% in October. This is just 0.2% lower than the rate of 4.3% recorded in September, but is a significant reduction of 4.0% from the 8.1% growth in prices seen in June.
“Acadata’s annual rate of 4.1% for October is considerably lower than the annual rate of price growth in the lenders’ mortgage completion price data – up 8.1% currently recorded by Halifax or the 9.9% seen at Nationwide. As discussed later on pages 8 and 9, the highest upward movement in house prices at present is being experienced by semi-detached homes which represent a higher proportion of the lenders’ portfolios than is seen in the Acadata figures, which are in this case bolstered by the significant number of detached homes and flats purchased with cash, most notably in the currently subdued London area.
“The slowing in price growth, as recorded by Acadata since June, relates to the ending of the first stage of the Stamp Duty holiday in England, along with the complete withdrawal of the Land Transaction tax holiday in Wales.
“The October monthly change in house prices in England and Wales amounts to 1.4%, down from the 2.2% increase seen in September, but the September figure was influenced by the termination of the SDLT holiday at the end of that month.
“The general picture is one of a slowing market, a theme that is common to earlier months and very much in line with the views of expert commentators across the market. Clearly, it was expected that this trend be reinforced by a rise in the Bank of England rate of interest, although in reality it didn’t materialise at the latest Monetary Policy Committee (MPC) meeting. The absence of a rate change – along with the MPC view that inflationary pressures will ameliorate in a few months – gives further support to the idea that although prices are slowing, the rate of deceleration will be modest, and further that certainly there will be no price collapse as some had previously suggested (e.g., the OBR, Office for Budget Responsibility). Indeed, the OBR is now forecasting low but positive rates in 2022 and into 2023, with a steady increase in subsequent years. On all counts this should give further encouragement to buyers and not least to those entering the market for the first time.
Transactions
“As noted before, our published HPI results for the latest five months from June to October 2021 are susceptible to change, since the number of transactions processed by the Land Registry for these months is lower than normal. The monthly transaction count from which we have derived the average prices for June, July, August, September and October are 68,598, 14,380, 15,188, 10,379 and 1,152 sales respectively – a total of nearly 110,000 transactions. These figures contrast with the HMRC estimates of housing transactions in England and Wales for the first four of those months of 200,000, 70,000, 91,000 and 150,000 sales respectively – well over half a million homes (the October HMRC totals are not yet available). The Land Registry consequently has a backlog of approximately 400,000 registrations to complete for these five months. Most polling companies would consider a sample size of 10,000 observations per month as adequate to provide a reasonable estimate of average prices – but small variations are likely.

“Regional reporting stands at the heart of the Acadata release, reflecting the great diversity of market performance across England and Wales.
“In general terms, all areas – except for Wales, the South East and Greater London – have seen their annual rates of growth bounce back from the low rates that were recorded In July and August – those months having seen a reduction in average prices due to the “forestalling” that took place, that is buyers bringing forward their purchases of high-value properties into June, in order to take full advantage of the tax-holiday that was in place at the time.
“Buyers in England who missed out on the first tax-holiday were given a second opportunity to save money, with the scheme being extended to the end of September, albeit at a lower threshold level. Consequently, there was a further scramble to complete on sales in September, with HMRC estimating that there were 150,000 sales in that month – up from the more typical level of 70,000 sales as seen in September 2019. Prices in September 2021 did therefore rise across most parts of England – however, from the Figure 1 graph the same remarkable spike in prices that had taken place earlier in the year cannot be detected.
“It is possible to argue that in Wales, with the tax-holiday ending in June, buyers were not party to these purchasing strategies (and also that sellers were possibly at a competitive disadvantage, with properties sold across the border still benefitting from tax-holidays), resulting in prices in the Principality recording a marginal slowing in growth, from 11.4% in August to 10.8% in September. Despite this, Wales did however remain as the area with the highest annual growth rate.
England and Wales Regional Heat Map for September 2021
“All of these different trends are highlighted in the Regional Heat Map for September. Once again, Wales stands out as being the only area shaded bright red, reflecting its current status as having the highest rate of annual price growth at 10.8%, while at the other end of the scale, Greater London is shaded light blue, being the sole area with growth rates below 3.0%. Working back from the areas with the lowest growth rates, we next have the North East on its own at 3.3%, with the South East and the East of England both seeing a 3.8% increase. The South West, and Yorkshire and the Humber have similar rates at 4.5% and 4.9% respectively, with the East and West Midlands at 5.8% and 5.7% apiece. Finally, the North West retains its title as having the highest rate of growth of all the English regions at 6.9%, and is the subject of closer examination later in this release.

A closer look at the North West of England
“For five of the last eight months the North West has been at the top of our regional league table in terms of having the highest rates of annual house price growth. Although the top position has now been taken by Wales, the North West continues to have the highest rate of growth of the nine GOR regions in England. We explore what has been occurring in the region.

Annual and Monthly Price Trends
“The change in prices in the North West in September needs to be considered in the overall context of the movement in prices in England and Wales over the same period. As described earlier, September 2021 represented the last month in which the SDLT tax-holiday was available to purchasers of properties in England. The threshold for the SDLT tax-holiday had been reduced to £250,000 from 1st July 2021, from its previous level of £500,000. As such, the tax saving that was available from the start of July 2021 to the end of September amounted to some £2,500 per transaction.
“There was therefore some pressure on buyers to achieve their purchases by the end of September to obtain the benefit of these savings. As a consequence, all ten areas within the North West Region saw prices in September increase, with monthly changes ranging from 1.8% in Halton to 7.9% in Cheshire East. Overall, prices in the region rose by 5.0% in the month, up from a reduction of 3.0% in August.
“Compared to one year earlier, average house prices in September in the North West have increased by close to £15,000, or 6.9%, up from the 4.4% recorded in August.
“The area with the highest percentage increase in prices in the North West is Blackpool, where prices over the twelve months have increased by some £21,500, or 16.9%. In Blackpool, all property types saw an increase in prices, the most significant being the increase in the cost of semi-detached homes, up from an average £210k in September 2020 to £250k twelve months later.
“The same factors seen in Blackpool also applied to both Warrington and Merseyside, which had the second- and third-highest growth in the North West over the year. All property types in Warrington and Merseyside saw an increase in values over the year, but especially the prices of semi-detached homes, up by £25,000 in Warrington to an average £242k, and by £16,000 in Merseyside to £211k.
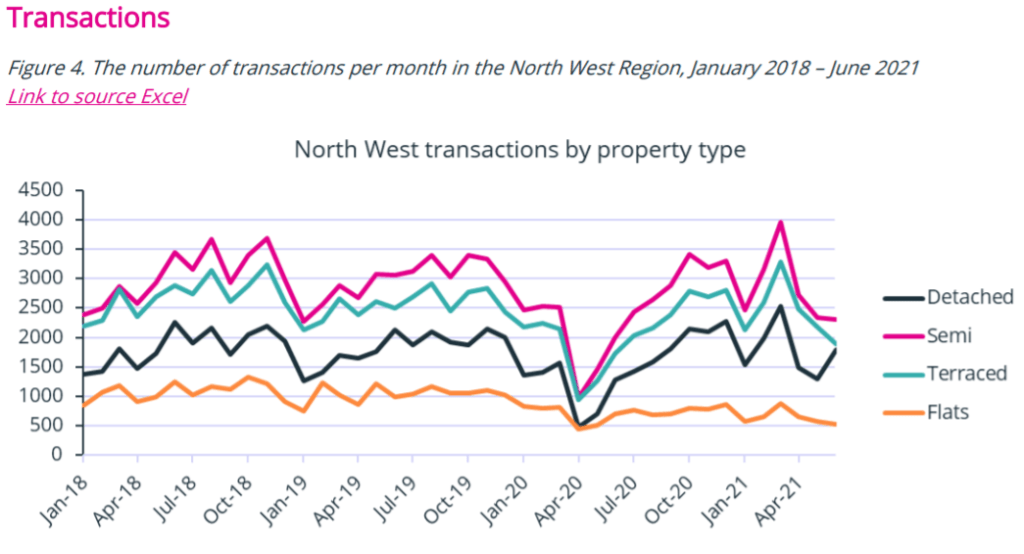
“Figure 4 shows the number of transactions per month in the North West, from January 2018 to June 2021, analysed by property type. The first two years of the above data give a general view of how property sales vary over the year, with lower numbers of homes being sold in January and February of each year, and sales then increasing over the summer months to higher volumes during the autumn.
“Figure 4 then illustrates the dramatic decline in sales volumes in April 2020 at the start of the Covid pandemic with England experiencing its first ‘lockdown’. This was then followed by a return to a more normal level of sales in the housing market, but also associated with ‘lifestyle changes’ as buyers looked to move to larger premises, often linked to the need to work from home. We can also see the surge in sales which took place in March 2021 at the time of the anticipated ending of the quite generous SDLT tax-holiday – later delayed until June. We anticipate that the graph will show a further surge in sales in June 2021, again linked to the tax-holiday – but unfortunately the Land Registry, from whom we obtain our data, are currently snowed under in housing registrations – so we will have to wait before we can quantify its full extent.
“The graph provides two further points of interest. The first is that of flats – which have not been as affected by the various stages of the pandemic in terms of the number of properties being purchased. We suggest that this is because ‘flatted’ properties do not fit well with the current lifestyle desire for large open spaces.
“Secondly, we can note that in the North West it is the semi-detached property that makes up the highest number of sales throughout the three-year period of the graph. Our analysis of sales in England and Wales shows that the North West has the second-highest proportion of semi-detached sales of all the GOR areas, at 35% – with the highest proportion being seen in Yorkshire and the Humber at 36%. This may well be one of the factors as to why the North West currently tops the house price growth league in England, i.e., this submarket having been very active, with consequent price impacts, notably in this region.